Introduction
Various persons and institutions have defined quality in varying ways. While most definitions agree that quality constitutes the notions of efficiency and consumer satisfaction, the definitions still remain subjective and dependant on the aspect and person defining it (Clinical Excellence Commission, 2009). Additionally, the central issues dictate the line that the definition takes. In essence quality definition is dependant on whether tangible goods are at the Centrum of definition or whether it involves intangible goods where human well being is of central importance (Australian Institute of Health and Welfare, 2009) It is on this basis that quality within a healthcare facility is defined with consideration of three aspects, namely: consumer satisfaction, professional assessment, and efficiency.
Quality has emerged as a measure of the degree of excellence of a product/service. Quality management has developed from mere inspection to cover more advanced concepts like total quality management. Such incorporations have broadened to cover modern interpretation techniques like ‘Six sigma’ which facilitate the essential processes, ideas, theories, and management tools that constitute organizational development, improved performance, and the improved general desire of individuals, teams, and corporate entities (Australian Institute of Health and Welfare, 2009) While the key objective of quality management is efficiency maximization and service delivery improvement, there are some fundamental aspects that must be addressed to attain this objective.
Quality within the healthcare department aims to improve service delivery to the community it serves. Commonly a backlash originates in terms of quality perception with regard to the various stakeholders. This is usually a function of the variation resulting from the desired, perceived, and actual quality that the department has to offer. Desired quality usually manifests itself through the customer’s perception, for instance, the public would wish for an ideal situation whereby all conditions are wholesomely treated.
Perceived quality on the other hand incorporates a realistic plan that given quality guidelines has set out to achieve. The actual quality, however, represents the achieved measurable quality at the end of an implementation process (Australian Institute of Health and Welfare, 2009). This paper presents a quality guideline initiative for the transformation of diabetic patient care within a general medical unit with the aim of improving it.
Background of study
One of the major healthcare issues raising great concern globally is diabetes care for affected patients. Many persons have been recently been diagnosed with diabetes, both in Australia and globally with figures rising from below 1.5 million in 1976 to over 10 million in 2007 (Agency for Healthcare and Quality, 2008) Diabetes poses increased health condition risks which may include renal failure, heart problem, retinopathy, peripheral neuropathy among others.
The estimated cost of diabetes and its related conditions is estimated to have cost the country $130 in 2008 (Clinical Excellence Commission, 2009) Evidence-based management has been cited as a possible method of alleviating the risk of the diabetic condition and its related complications. Additionally, it is important to develop assessment instruments for the care that patients are given. It was recently highlighted that healthcare quality remains suboptimal and experiences a reduced pace of improvement (National Healthcare Survey, 2008).
With specific regard to diabetes, the report cited various service areas that experienced sub-optimal care with 71% of adults aged over 40 years receiving foot exams, dilated exams being performed on 60,% and 90% receiving AIC test. Despite the importance of all the three components, only 40% were given all three (National Healthcare Survey, 2008). The care rates and practices have remained relatively stagnated over the last three years.
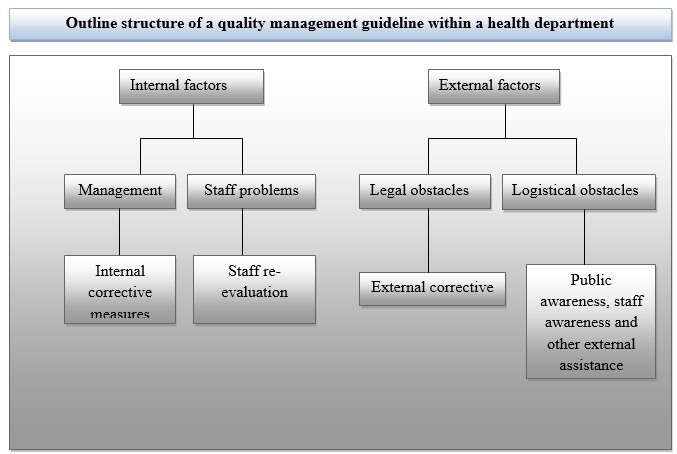
The medical center examined in this case provides diabetic care to rural communities in Queensland. The diabetic department within the medical facility cares for 22000 adults and makes approximately 50000 annual visits to the patients within the community. Type 1 and type 2 diabetes patients make up approximately 8% of institutional facility patients (Australian Institute of Health and Welfare, 2009). On this basis, the condition was chosen for the pilot project after which recommendations on possible modifications were to be drawn. EvidEvidence-based cement was chosen as the best probable way with which appropriate Medicare treatment would be availed to the appropriate diabetes patient (Catherine et al. (2007).
Care Problem
Reported quality measures on institutional diabetes care were checked and analyzed. Similarly, national reports and benchmark initiatives to primary diabetes care measures were analyzed. Most measures in place, registered sub-optimal performance where for instance 18, 39, and 88% were recorded for foot, eye, and AIC measures respectively (Australian Institute of Health and Welfare, 2009). The need to identify the reasons for sub-optimal performance and hence introduce evidence-based care treatment as a measure to curb the same is highlighted as being of increased and fundamental importance if diabetes patient care was to be efficiently performed.
Expected benefits from the quality initiative
The quality initiative is aimed at ensuring service provision to the patients is kept at optimal while at the same time the medical facility gains some savings as a result of investing in the initiative. While often some individuals have been quick to mention that quality comes with attached costs, the ultimate spending is eventually reduced. The diagram below illustrates the costs and benefits associated with quality management.
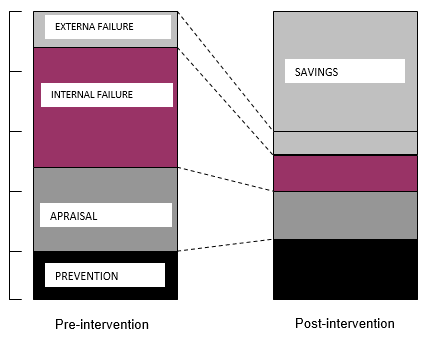
While the costs incurred to undertake preventive measures and appraising the quality initiative increase, both internal and external failures are enormously reduced thus proving important and beneficial in the end.
Justification of the health improvement choice
Diabetes levels are defined based on four-level statistics. These are based n nationally set quality indicators that assess the trends resulting from this condition. The major statistical indicators include the number of uncontrolled diabetic hospitalization cases per every 1000,000 population, short-term hospital admission due to short term complications per 1000,000 population, admissions resulting from long-term complications per 1000,000 population, and admissions from lower extremity amputations per 100,000 populations (Australian Commission on Safety and Quality in Health Care, 2009).
An increase in any of these areas brings with it inflated costs that could have otherwise been avoided if action had been taken early enough. State data statistics, unfortunately, indicates a trend of spiraling up figures in relation to the aforementioned (Australian Commission on Safety and Quality, 2009). It is therefore vital that best practices are developed in order to curb the rising numbers and hence reduce associated costs and at the same time improve the living conditions of the affected population.
Health improvement plan
Improvement of quality in healthcare provision to diabetes patients requires a systematic approach in order to ensure its success (Griffith & Wiese, 2004). This process begins with formation of a strong team to look into team existing baseline statistics that indicate areas of failure. Quality control tools play a handy role in coming up possible causes to the problem to be addressed (Griffith and Wiese, 2004). It is on the basis of the above mentioned that an assessment tool is developed in order to propose key area that require attention in order to improve quality provision in respect of the selected area.
Communication of quality requirements is fundamental for the success of the project. Additional it is important to identify the difference between desired, actual, and perceived quality of the with respect to the standard set by the respective health standardization body. However, the structure mentioned above takes a more generalized approach in provision of quality guideline within the department. A more elaborate six sigma plan takes the above into consideration while at the same time offering a more insightful approach into quality management and assessment in the department.
The principles of quality and their application
There exist various quality principles and applications that constitute a health care department quality management. Quality if a fundamental part any police department in its endeavor to serve the public. Attainment of an organizations strategic objective is pegged on the successful implementation and monitor of the quality management practices laid down. Application of quality principles incorporates the use of various tools and techniques which acts as monitor and evaluation instruments. Such tools and techniques include just in time, Kaizan, Kanban, Sigma six among others. Additionally other performance measurement instruments may be used. These include various statistical tools and quality measurements applications and graphs.
Methodology
Monitoring the systems performance within a department in order to adequately manage quality is dependant on the technique employed. ‘Sigma six’ employs the use of a process often referred to as DMAIC as illustrated below. This involves a stepwise process beginning by definition of the problem, its measurement, analysis, improvement and finally control. Recent the process has been expanded to DMAICT which in addition to the already mentioned steps incorporates transfer of the gains achieved.
The gains obtained are usually measured in relation to the laid down quality standards in accordance with the quality triangle illustrated below;
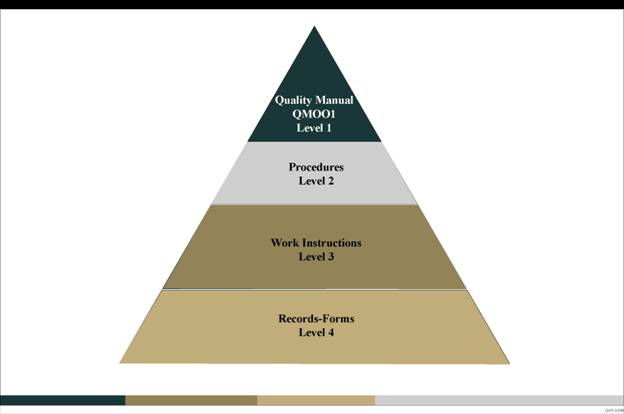
Prioritization of causes is important if success is to be obtained. This is done with the help of Pareto analysis discussed later where the least causes that result into a large percentage of the inefficiencies are identified and prioritized.
Total quality management
Recent trends have seen the emergence of total quality management as a fundamental tool in quality maintenance and upgrading (Bruce, & Suzanne, 1992: 119). Implementation of total quality management requires incorporation of tools that allow information to be collected directly from the general public that the health facility serves. This is done based on categories that are deemed to directly affect the quality of performance of the department.
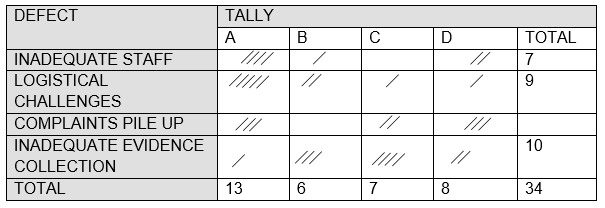
Using the checklists already discussed, the tallies can form the pillars upon which evaluations are based, data collected and eventually analyzed as described in sigma six. Processing of such data ensures there is continuous process improvement and management. Additionally, processes that require support from stakeholders can only be successful if the stakeholders are adequately motivated to effectively perform their work.
Check sheets
Check sheets may be used to measure the attributes (Pass/Fail) data figures in defining of the problem and hence identification (Wolff, 2004). Below is an example of a check sheet for a health department’s initiative.
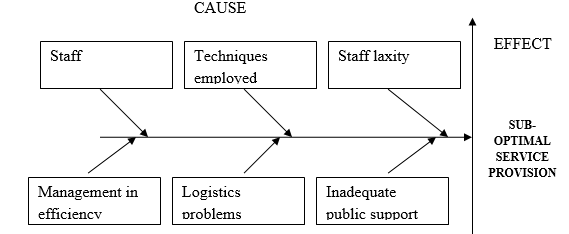
Cause and effect diagrams and process analysis diagrams
Pareto analysis
Pareto diagrams help in identification and prioritization of areas of problem. A Pareto diagram is a special type of histogram that helps us to identify and prioritize problem areas. Such diagrams are based on collected data. It in essence focuses attention to the most frequent problems and the level of effect associated with it. By using Pareto analysis the vital few contributors that result into most of the quality problems within the department are identified and hence prioritized appropriately. It in essence offers a foundation for measure of significant factors that in reality appear insignificant and thus inconsequential.
Other than the discussed tools, other tools can also be used in enhancing quality management. Control charts form effective tools for assessment of quality aspects of the department’s performance. Control charts indicate the level of deviation of a process from the desired mean. The diagram below illustrates a Pareto analysis.
Table 1: Sample Pareto Analysis.
Intended Improvement
Most of patient care initiatives were designed relative to acute care guidelines and principles rather. Frequent patient information inaccessibility made it cumbersome to establish whether an exam or a test was referred for a particular patient’s case. With the help of a cause and effect diagram, a number of areas were identified which need modifications if an improvement was to be recorded in service provision. The identified areas included staff efficiency, logistical challenges, management problems, and the techniques employed.
The improvement is facilitated by a broad team consists of various professionals including nurses, physicians and management support staff. The team engages the hospital staff and Medicare providers in activities that attract an encourage them to engage in quality improvement in provision of diabetes care. The initiative is hypothesized on the fact that improving staff efficiency, logistical management e.g. workflow processes, improved management practices and re-assessment of techniques used will result into an improved healthcare management process.
The main question to be addresses to be whether, improved staff practices could ultimately result into a positive change in service delivery. The knowledge on best engagement ways of staff members in work improvement was noted as pre-requisite.it was important to determine the actual areas that need improvement.
Interventions and Measures
To realize the major objective of the initiative, there measures are employed in intervention of the aforementioned problem (Australian Commission on Safety and Quality in Health Care, 2009). The initial strategies focused on visit based care. A systematic approach to preparation of patients and increasing the individual data availability in the system with the help of licensed nursing assistants (Wolff, A. M. et al (2004). An additional measure in intervention involves team participant’s engagement to ensure monthly data transparency. The improvement team promoted dialogue between healthcare providers, LNA’s and management staff.
This facilitated target process identification and measurement of outcome of process variations resulting. Care areas covered in improvement include annual foot and eye examinations, yearly micro albumin measurement as well as AIC testing and pneumococcal vaccinations.
A data reporting system is put in place for retrieval of data from laboratory and management systems. Based on the data, a monthly cohort report is developed. Each patient’s data are individually reported and stored for ease of retrieval during future visits. These include their primary care provider, values from laboratory and preventive quality initiatives finishing point. The second measure Pre-appointment patient identification and determination of EMR where test are needed and documentation of this data in flow sheets (Australian Commission on Safety and Quality, 2009)
Processes automation will allow current and forthcoming data integration into the workflow operations. Patient’s individual data summary can be easily be accessed prior to the patients visit. Additionally, improvement measures for care of diabetes were introduced for patients suffering related conditions like heart failure, and coronary artery ailments. Process and outcome transparency is the ultimate objective of the third intervention.
The third intervention is entirely focused on process and outcome transparency. The improvement team will undertake a review of aggregate level data on practice levels and returned monthly reports. Obtained results will be analyzed using a range of statistical tools available in quality control. This will include control charts/pareto charts. Special cause variations will be noted based on the set control limits in order to establish the level of success of the initiative. Large variations indicate lack of success while vice-versa is true.
Data collection
Data collection is facilitated with the aforementioned multi-disciplinary team. However, most of data collection will be performed by the data reporting system put in place. All patient information will be directed compiled into a central at a point from where they will be easily obtained for analysis of the initiative. The full assessment data will be obtained after a six month to one year program. Data from both clients and staff will also be important in evaluation of the impact on the initiative to area other than its planned objective. For instance it would be important to know the psychological implications of the initiative on the staff in order to establish its applicability.
Results
Analysis of the results will be based on collected at in comparison to the present scenario prior to introduction of the quality measure. Successful quality evaluation measures must however compare to standard assessment procedures in the area in question. Baseline standards set define the standard upon which the final success evaluation will be based. The performance of the core diabetes care measures will be potted in appropriate quality control charts and graphs and evaluated against set standards. It is importance to note that an improvement from the existing state may not necessarily indicate the initiatives success. However, meeting the set standard guideline procedures approved nationwide are indicative of a successful initiative.
Statistical graphs will be used to show the performance of patients who engaged in the program against those who did not in order to compare and establish possible milestones achieved by the health improvement initiative. Changes in examination rates will also be evaluated and deviations from the desired baseline appropriately obtained and conclusions drawn.
Conclusion
The success of the initiative is entirely dependant on the commitment of the management towards supporting of the implementation team. It is important that all stakeholders come together and recognize the need for change and hence facilitate the implementation of the proposed pan. Quality has increasingly gained popularity as the core principle of success within each organization.
References
Agency for Healthcare and Quality. (2008). National healthcare quality report—2008. Web.
Australian Commission on Safety and Quality in Health Care (2009). Falls Prevention Guidelines. Web.
Australian Commission on Safety and Quality in Health Care. (2009). Clinical Handover. Web.
Australian Commission on Safety and Quality. (n.d). Medication Safety. Web.
Australian Commission on Safety and Quality. (2009). Patient Identification. Web.
Australian Institute of Health and Welfare. (n.d) Other Australian Information on safety and quality of health care. Web.
Catherine McKinley et al. (2007). Evidence-based Management Practice: Reducing Falls in Hospital, Collegian, 14 (2), p 20-25
Clinical Excellence Commission. (2009). Blood Watch Program. Web.
Griffith, R. and Wiese, J. (2004). Leading and Enhancing quality in nursing care. In Daly, J., Speedy, S. & Jackson, D. (Eds). Nursing Leadership. Sydney: Churchill Livingstone. p 233 – 249.
Taylor, B.A. & Jones, S. (2006). Clinical governance in practice: closing the loop with integrated audit systems, Journal of Psychiatric and Mental Health Nursing, 13(2), p 228–233.
Wolff, A. M. et al (2004). Using checklists and reminders in clinical pathways to improve hospital inpatient care, healthcare, 181(8), p 428 -432.