Abstract
Succession is an important ecological concept that explains how ecosystems undergo a series of changes in terms of species diversity over a period. In this view, dune succession refers to ecological changes that take place in dune systems around lakes or along coasts. This study examined dune succession by assessing the species density of primary, secondary, and late species.
Besides, the study assessed concentrations of water, carbon, and nitrogen along the succession of the dune. The findings show that primary species density decreases with an increase in dune age, but secondary species density increases with an increase in the age of the dune. Similarly, the findings show that water content, carbon concentration, and nitrogen concentration increase with species diversity and the age of the dune.
Introduction
In ecology, succession entails processes that an ecosystem undergoes over a period from simple colonization by individual flora and fauna through into a state of climax community. At the climax state, a community becomes an ecosystem that is only dependent on climatic factors in its survival. Raevel, Violle, and Munoz (2012) view succession as an essential concept that explains how ecosystems change with time. In this view, dune succession comprises ecological changes that occur in dune systems, which are common in coastal habitats. According to Martinez, Gabriela, and Sanchez (2001), succession is “the non-seasonal and continuous processes of colonization and extinction of species populations on a site” (p. 361).
The intermittent colonization and extinction of species characterize ecological processes of succession that take place in various ecosystems. Dune systems are unique ecosystems because they exist at the interface of marine and terrestrial environments. Hence, dune succession is dependent on terrestrial and marine factors that influence the processes of succession. Therefore, the dune study succession provides insights on how succession takes place at the interface of the terrestrial and marine environment.
Succession depends on the nature of the environment in which succession occurs. Generally, succession can be primary or secondary, depending on the nature of the environment that succession takes place. Primary succession is a succession in which flora and fauna colonize an environment that no ecological community has ever occupied. Martinez, Gabriela, and Sanchez (2001) state that primary succession usually occurs in environments, such as sandy beaches, rocky surfaces, and volcanic surfaces.
Mosses and lichens are common flora that colonize such environments where no community has ever colonized. Comparatively, secondary succession entails the colonization of an environment that has already been colonized by other ecological communities. Emery (2012) explains secondary succession as the process of displacing a pre-existing community by the new community through the colonization process. Disturbance of pre-existing communities normally creates room for the incoming communities to colonize and cause ecological succession. Disturbances such as human activities, floods, fire, and other natural disasters trigger an ecological succession in some habitats.
Ecologists have formulated different theories and developed various models that elucidate how succession occurs in different ecosystems. Models that explain ecological succession include inhibition, tolerance, and facilitation (Nzunda, 2011). The inhibition model holds that the native community adapts to the colonized environment and modifies it to inhibit secondary succession. In essence, the primary community inhibits the occurrence of secondary succession by transforming the environment and making it unfavorable to other flora and fauna, which attempt to cause secondary succession.
The tolerance model supposes that succession occurs because of the ability of fauna and flora to tolerate environmental conditions. According to this model, the early community does not change the environment, but rather tolerate its conditions until it reaches a state of climax (Hubbell, 2001). Comparatively, the facilitation model states that early community facilitates succession of the subsequent communities in the succession process. Molles (2010) argues that “pioneer species modify the environment in such a way that it becomes less suitable for themselves and more suitable for species characteristic of later successional stages” (p. 462). Essentially, an early community colonizes the environment and facilitates the success of subsequent communities while facilitating its extinction.
The project examines a dune succession as it offers the ideal environment where primary succession occurs. The experimental approach of the project is ‘space for time replacement’ because it allows researchers to examine changes that take place in dune communities. Thus, to examine dune succession, the project assesses how primary success occurs in Lake Michigan, Indiana.
Aims and Hypotheses
The project seeks to achieve two main aims by assessing dune succession.
- To establish the composition and density of species across dune succession with a view of ascertaining how dune succession occurs.
- To find out the factors that have contributed to the increase in species diversity and number across dune age during the progress of succession.
The following are the hypotheses of the project.
Observational aspects
- H1: Number of species (species richness) increases with dune age.
- H1: The overall number of species observed increases with dune age.
- H1: The density of pioneer species (marram grass and cottonwood) decreases with succession, but the density of secondary species (little bluestem, goldenrod, and black oak) increases with dune succession.
- H1: The density of herbaceous species (grasses and forbs) decreases with succession, but the density of woody species increases with dune succession.
Mechanistic Aspects
- H2: Soil water content, carbon (C), and Nitrogen (N) concentrations increase with the dune age in both 0-15 and 15-30 cm soil depth.
- H2: Species diversity increases with increasing soil water availability
- H2: Species diversity increases with an increase in the concentration of carbon in the soil.
- H2: Species diversity increases with an increase in the concentration of nitrogen in the soil.
Experiment 1: Observational Aspects
Four sites with progressively older dune age were marked for observation study. Transects of 25m by 2m were made in each of the sites, and further 1m by 1m quadrats were constructed inside the transects. Four quadrants were constructed, and each of them was placed 4m apart. The number of species in each quadrat was counted and recorded in the table. Target species such as cottonwood, marram grass, black oak, goldenrod, and little bluestem were counted. Moreover, a bunch of tillers and individual tillers were identified.
Experiment 2: Mechanistic Aspects
Using the same marked sites progressively across the age of the dune, characteristics of the soil were assessed. Soil corer was used to sample soil from the depths of 0-15cm and 15-30cm in each of the four quadrants. All soil samples from 0-15cm depths were pooled into one Ziploc bag, while all samples from 15-30cm depths were pooled into another Ziploc bag. Each of the samples of the soil collected was labeled according to transect and dune. In the analysis, relative water content, carbon, and nitrogen concentrations were determined. To determine the relative water content, some samples of soil were dried and compared with fresh soil using the following equation.
RWC = (g fresh soil) – (g dry soil) × 100
(g dry soil)
The concentration of carbon and nitrogen were determined using an elemental analyzer.
Statistical Analysis
The project employed correlation in data analysis to establish the nature of relationships that exists between species diversity and distance from the shore. Moreover, the project uses correlation to establish the nature of relationships that exist between species diversity and water availability, carbon concentration, and nitrogen concentration.
Results
Species Diversity
The study found out that species diversity increases with an increase in distance from the shore. At 50m from the show, two species were dominant (marram grass and cottonwood), while five species were common at 150m from the shore (marram grass, little bluestem, goldenrod, wormwood, and cottonwood). At 500m and 800m, the diversity of species increased exponentially to 19 species.
Experiment 1: Observational Aspects.
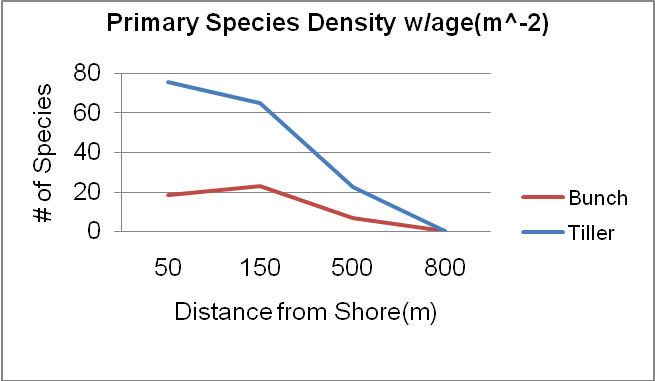
Primary species density of marram grass (bunch and tiller) decreases with an increase in distance from shore. Correlation analysis shows that marram grass (bunch) has a strong negative correlation with distance from the shore (r = -0.952). Moreover, the density of marram grass (tiller) negatively correlates with distance from the shore (0.995). The decrease in species density of marram grass with the increase in distance from the shore is significant (p= 0.048). The p-value is less than the significance value (p<0.05).
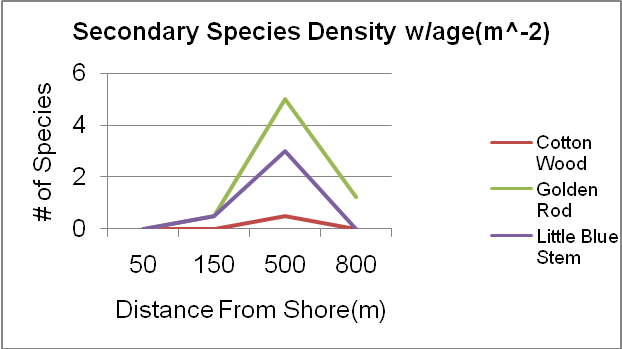
The secondary species density of cottonwood, goldenrod, and little-blue stem reaches an optimum density at 500m from the shore. Regarding cottonwood, correlation analysis shows that there is a weak correlation between distance from the sea and cottonwood species (r = 0.24). The correlation between distance from the shore and goldenrod is also weak (r = 0.44). The little bluestem shows the weakest correlation with the distance from the shore (r =0.17). The significance values of these correlation values are greater than 0.05 (p>0.05). It means that there is no correlation between secondary species and distance from the shore.
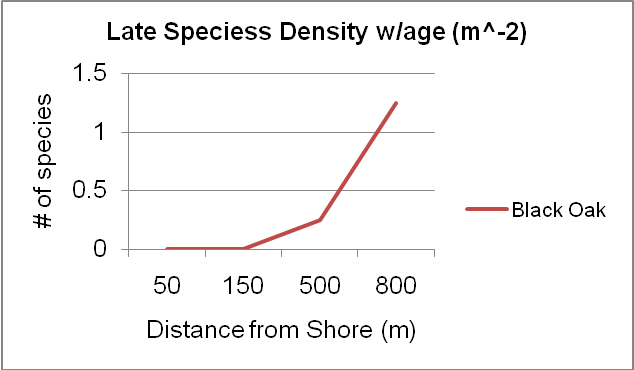
The late species density increases with an increase in distance from the shore and reaches an optimum density at 800m. The correlation analysis shows that there is a strong correlation between black oak density and distance from the shore (r = 0.919). However, the correlation is not significant because the p-value is 0.08 (p>0.05). This implies that late species density does not vary according to the distance from the shore.
Experiment 2: Mechanistic Aspects
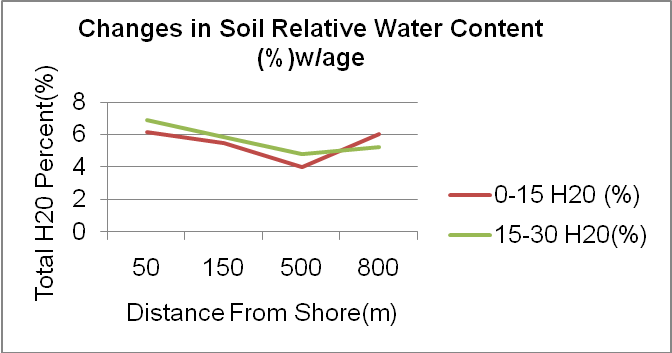
The figure shows that relative water content decreases with an increase in distance from the shore up to 500m, where it increases. Correlation of the distance from the shore and relative water content is weak for 0-15cm (r = -0.16) and strong for 15cm-30cm (r= -0.77). This means that relative water content in 0-15cm does not decrease as the distance from the shore increases. Comparatively, relative water content does decrease as the distance from the shore increases. However, the decrease in relative water content is not significant (p>0.05). Thus, relative water content does not correlate negatively with distance from the shore.
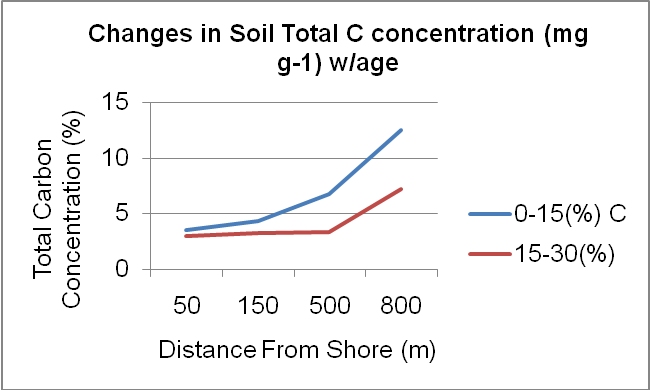
The above chart shows that the concentration of carbon increases in both the depths of 0-15cm and 15-30cm with an increase in the distance from shore. The concentration of carbon in both 0-15cm and 15-30cm depths strongly correlate with distance from the shore (r = 0.89, 0.86). The correlation is significant as carbon concentration increases with distance from the shore (p<0.05).
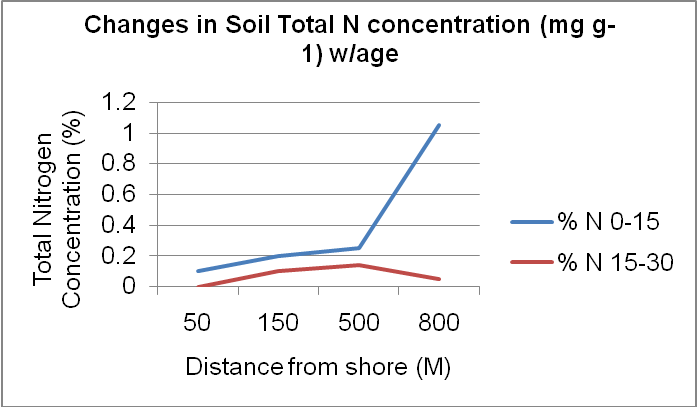
The concentration of nitrogen increases in 0-15cm and decreases in 15-30cm with an increase in the distance from the shore. Correlation value for nitrogen in 0-15cm is strong (r = 0.88), while the correlation value of 15-30cm is weak (r = 0.26). This means that the nitrogen concentration significantly increases with distance from the shore in 0-15cm (p<0.05). However, the decrease in nitrogen concetration15-30cm depth
Discussion
In the first experiment, the study showed that species diversity increases with the age of the dune. The finding shows, that there is a progressive increase in species diversity from primary, secondary, and eventually late species. Moreover, the study demonstrated that the species density of primary and secondary species varies according to the age of the dune. In the case of primary species, the study showed that species density decreases with an increase in the distance from the shore.
Hence, the findings support the hypothesis that primary species density increases with dune age. These findings are consistent with the earlier findings of Lake Michigan, which report that primary species facilitate colonization by late species (Lichter, 2000). Hence, primary species density decreases with an increase in the age of the dune due to their role of facilitation. In this case, marram grass facilitates secondary succession.
Comparatively, species such as little bluestem, goldenrod, and black oak are some of the secondary species, which the study demonstrated to increase with an increase in the age of the dune. These findings are in line with the findings of Maun (2009), which state that species density increases with an increase in the dune age. Thus, the findings support the hypothesis and confirm the earlier findings. Likewise, the study found that the late species density of black oak increase with the age of the dune.
The findings support the hypothesis that the density of woody species increases with dune succession. The late species density increases with the age of the dune because they are dependent on the facilitation processes of primary and secondary species (Johnson & Miyanishi). Therefore, the density of black oak increases with dune age due to facilitation created by primary and secondary.
In the second experiment, the study found out that soil water content, carbon concentration, and nitrogen concentration varies according to the succession of the dune. Relative water content decreases with the age of the dune up to 500m, where it increases beyond 800m. Likewise, the diversity of species increases with an increase in the distance from the shore. Martinez and Psuty (2007) argue that “as succession progress, species diversity increases” (p. 72).
Hence, it implies that changes in relative water content across dune succession influence species diversity. Moreover, the study found out that the concentrations of carbon and nitrogen in 0-15cm depths increase with dune succession, and thus correlate with species diversity. These findings support the hypothesis that carbon and nitrogen concentrations enhance species diversity. However, the case is not true in the concentration of nitrogen in the depths of 15-30cm.
Conclusion
The dune succession study shows that primary species density decreases with an increase in dune age while secondary species density increases. The difference in species density between primary and secondary species is due to the facilitation process. While primary species facilitate colonization of the environment by other species, secondary species require an already colonized environment. Furthermore, the study reveals that the concentrations of water, nitrogen (0-15cm), and carbon increase with the age of the dune, and thus increase species diversity.
References
Emery, S. (2012). Succession: A Closer Look: Nature Education Knowledge, 3(10), 45-63.
Hubbell, S. (2001). The Unified Neutral Theory of Biodiversity and Biogeography. Princeton: Princeton University Press.
Johnson, E., & Miyanishi, K. (2010). Plant Disturbance Ecology: The Process and the Response. New York: Academic Press.
Lichter, J. (2000). Colonization Constraints during primary Succession Coastal Lake of Michigan Sand Dunes. Journal of Ecology, 88(5), 825-839.
Martinez, M., Gabriela, V., & Sanchez, S. (2001). Spatial and Temporal Variability during Primary Succession on Tropical Coastal Sand Dunes. Journal of Vegetation Science, 12(3), 361-372.
Martinez, M., & Psuty, N. (2007). Coastal Dunes: Ecology and Conservation. New York: Springer.
Maun, M. (2009). The Biology of Coastal Sand Dunes. New York: Oxford University Press.
Molles, M. (2012). Ecology: Concepts and Applications. New York: McGraw-Hill Education.
Nzunda, E. (2011). Sprouting, Succession, and Tree Species Diversity in a South African Coastal Dune Forest. Journal of Tropical Ecology, 27(2), 195-203.
Raevel, V., Violle, C., & Munoz, F. (2012). Mechanism of ecological succession: Insights from Plant Functional Strategies. Ecology & Organismal Biology, 121(11), 1760-170.