Introduction
Ecosystem comprises of biotic and biotic factors that are present in a given environment. The biotic factors are the living organism such as microbes, plants, and animals, while the abiotic factors are nonliving components like water, air, rocks, soil, sunlight, and topography. The interaction of biotic and abiotic factors in a certain environment occurs in a form of a system due to the flow of nutrient and energy.
In essence, ecosystem examines how biotic and abiotic factors interact as a self-sustaining system (Chapin, Matson, & Vitousek 2011). The nutrient and energy cycles depict how the biotic and abiotic factors interact in a sustainable manner over a long period leading to the development of communities in various environments. Ecology provides a view of understanding the processes that occur in ecosystems.
Chapin, Matson, and Vitousek (2011) assert that the flow of energy and chemicals through the physical and biological pathways depicts the relationships between biotic and abiotic factors in an ecosystem. In this view, the flow of energy and chemicals is central in the study of ecosystem. Therefore, this report examines ecosystem of the botanic garden of Geelong, which is in Vitoria, Australia.
Method
In examining the ecosystem of Geelong botanic garden, the study used observation as a method of collecting vital information necessary for the understanding of the ecosystem. Observation is a scientific method that utilizes the five senses, namely, sight, smell, sound, touch, smell, and taste, in collecting different forms of data from an ecological area of study (Chapin, Matson, & Vitousek 2011).
The observation method is important in ecological studies because it deals with physical and biological aspects of the environment, which require the use of the five common senses in collection of information. By using the observation method, the study identified biotic and abiotic components with a view of elucidating their interaction mechanism at the Geelong botanic garden.
In examining biotic components, the ecological study utilized a quadrat when determining the diversity of plants. A quadrat enables researchers to select an area for study, and thus enhances accuracy of data collected. The study used quadrats that measure 1×1, 2×1, 2×2, 2×4, 4×4, and 4×8 meters square.
The use of many quadrats enhances accuracy of data, and thus offers a comprehensive study of the ecosystem of the Geelong botanic garden. The increasing sizes of quadrats are essential in determining species richness and diversity in the Geelong botanic garden.
The study categorized plants as trees, shrubs, herbs, and grasses. In the study, the researchers identified plants, categorized them, and provided their numbers in different quadrats. The study then tabulated the findings obtained from different quadrats for further analysis.
Regarding animals, the observational study identified animals present at the Geelong botanic garden. The common animals present are birds, reptiles, and insects. Given that animals belong to the advanced trophic levels of primary, secondary, and tertiary consumers, they are significant in the study because they depict how energy and chemicals flow in the ecosystem.
According to Chapin, Matson, and Vitousek (2011), the first trophic level determines the amount of energy in an ecosystem because organisms that are present in this energy level are producers. Hence, the existence of animals in the Geelong botanical garden is dependent on the existence of producers, which are the primary source of energy, and other animals in different trophic levels.
Moreover, the study elucidates how biotic and abiotic animals interact and provides the mechanism of interaction. The study used food chain in illustrating how different organisms interact and transfer energy from one trophic level to another.
Examination of the food chain in the Geelong botanic garden illustrates the flow of energy through various forms of organisms. Hence, the observational study is keen on establishing the interaction of organisms and the flow of energy from the lowest trophic level to the highest trophic level, which exist in the Geelong botanic garden.
Results and Discussion
Distributions of Plants
Table 1
The above table shows the distribution of species across all quadrats ranging from the smallest to the biggest. The study selected two areas of study, area 1 and area 2, and assesses the species richness and diversity. From the table, it is evident that the cumulative number of species increases as the area of the quadrat increases.
The important information that one can derive from the table is the species richness and diversity of Geelong botanic gardens.
Scheiner, Cox, Willig, Mittelbach, Osenberg, and Kaspari (2000) argue that species richness is an important ecological variable that provides a view of an ecosystem in terms of diversity of organisms in a given area. Thus, the table provides a face value of the species richness and diversity of plants present in the Geelong botanic garden.

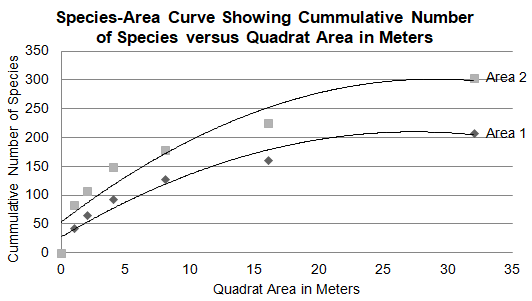
Chart 1: Species-Area Curve
The above chart shows the species-area curve of two areas of study, area 1 and area 2. Evidently, the species curve shows that the species of plants in the Geelong botanic garden increases with the increase in the area of the quadrat. The relationship between species and area has significant importance in ecology because it provides a view that enables ecologists to predict the diversity of species in various ecosystems or habitats.
Communities that have dense populations tend to be more diverse than communities that have scattered populations. Hence, the species-area curve of the Geelong botanic gardens shows that it has a dense population of plants, which is very diverse.
Given that is impossible to estimate the diversity of organisms in a given area with reasonable accuracy, the species-area curve enables accurate estimation of species using quadrats.
According to Scheiner, Cox, Willig, Mittelbach, Osenberg, and Kaspari (2000), the species-area curve is an ecological tool that enables ecologists to standardize ways of estimating species richness in various ecosystems. From the above chart, species richness increases from about 50 species per one meter square to approximately 300 species per 32 meters square.
The species-area curve also provides a mathematical way of understanding diversity and species richness. The equation for the species-area curve is S = cAz. Where S is the number species, c and z are constant, while A is the area of the habitat. This equation shows that the species richness has a nonlinear relationship that is dependent on two constants, c and z.
The chart shows that the species richness of plants in the Geelong botanic garden has a non-linear relationship within the area under which they grow. To enhance clarity of the equation, its conversion into a linear equation is imperative. Therefore, the linear equation of the specie-area curve is logS = zlogA + logc. This is a linear equation, which shows z as the slope of the equation and logc as the y-intercept.

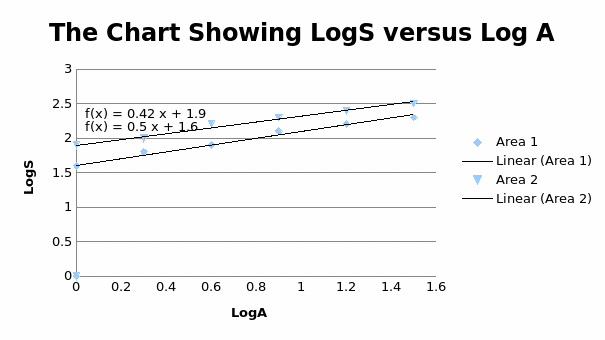
Chart 2: Log-log scale
The log-log scale indicates that the species number and the area of the habitat have linear relationships in the Geelong botanic garden. In the area 1 of the habitat, c (y-intercept) is 1.6 and z (slope) is 0.497, while in the area 2, c (y-intercept) is 1.9 and z (slope) is 0.418. Hence, ecologists can utilize these constants when interpreting the species richness and diversity of the Geelong botanic garden.
The log-log scale expounds the species-area curve because it provides constants that mediate the relationship between species number and the area of habitat (Scheiner, Cox, Willig, Mittelbach, Osenberg, & Kaspari 2000).
The application of the mathematical equation in the analysis of species diversity and richness is critical because it provides a scientific way of analyzing and predicting process that occurs in the ecosystem. In this case, the ecosystem of the Geelong botanic garden shows that its species richness and diversity increase as the area of habitat increases.
From the species-area curve, the trends of the curve give important information about the area that gives the maximum number of species. Apparently, the species richness of area 1 increases from about 40 species per meter square to approximately 220 species per 28 meters square at the plateau point.
Moreover, the species richness of area 2 increase from about 50 species per meter to approximately 300 species per 30 meters square at the plateau point. This means that in the average area of 25 to 30 meters square, Geelong botanic garden gives maximum species richness.
Plateau point is an important point in study because it shows the maximum number of species and minimum area necessary to attain. Thus, the plateau point indicates that the area of the habitat sampled by the quadrat is enough to represent all species in the habitat (Scheiner, Cox, Willig, Mittelbach, Osenberg, & Kaspari 2000). Therefore, species curve is important in determining sample size.
The number of species and environmental heterogeneity are two factors that determine the relationship between area and species. In a homogeneous environment, the number of species increases with increase in the area of habitat.
However, the number of species in a given ecosystem does not increase indefinitely due to the existence of diversity among the population of plants (Scheiner, Cox, Willig, Mittelbach, Osenberg, & Kaspari 2000). This explains why the species number reaches a plateau point as habitat size increases. Additionally, heterogeneity of the environment is a factor that determines the shape of the species-area curve.
The homogenous environment allows plants to grow uniformly over a wide area due to the evenness of the factors that support their growth. In contrast, the heterogeneous environment allows staggered growth of plants, which violates the normal relationship species richness and the size of habitat.
In this view, the Geelong botanic garden has a homogenous environment because the species-area curve of area 1 and area 2 do not have significant differences in species richness and diversity.
Distribution of Animals
The distribution of animals at the Geelong botanic garden is not evident because few animals are visible within the vicinity of the study. The huge animals present in the Geelong botanic garden are birds and rodents.
The birds were flying in the air while others were singing in different trees that were within the vicinity of the study site. Occasionally, different forms of rodents ran from one bush to another as they mate and search for food in small bushes in the Geelong botanic garden. Other animals present in the Geelong botanic garden are insects.
The insects are the dominant population of animals because they occupy small spaces in the garden and feed on numerous foodstuffs. In essence, the resources the insects require to survive are unlimited, unlike huge animals in which the availability of food determines their growth and reproduction in a given ecosystem.
Interaction of Biotic and Abiotic Factors
In the ecosystem, plants, animals, and abiotic factors interact physically and chemically. The physical interaction between animals and plant is apparent because birds live on trees, perch on trees, and obtain protection. Moreover, rodents hide in the bushes and rocks that are in the garden. Plants also anchor on rocks and soil while they are growing.
Regarding chemical interaction, animals, plants, and abiotic factors interact due to the flow of chemicals and energy from one trophic level to another.
Chapin, Matson, and Vitousek (2011) argue that trophic interactions are an important form of interaction in the ecosystem because it determines energy flow and consequently the population of organisms in a given ecosystem. The Geelong botanic garden is a very robust ecosystem because it sustains a great number of organisms as reflected by the diversity and species richness.
Energy Flow and Chemical Cycling
The flow of energy and chemicals in an ecosystem is dependent on the trophic levels of organisms. Miller and Spoolman (2010) argue that food chains and food webs in ecosystems are pathways through which energy flow from one trophic level to another.
In the Geelong botanic garden, green plants are the primary producers. Plants are the primary producers in the ecosystem because they generate energy from the process of photosynthesis. Plants take in nutrients from the environment and metabolize them into complex molecules, which provide energy to the ecosystem.
Essentially, the process of photosynthesis allows plants to combine carbon, oxygen, and hydrogen with the help of sunlight and chloroplasts to form carbohydrates and other complex molecules (Miller & Spoolman 2010). In this view, plants are the primary source of energy in the Geelong botanic garden.
Animals that feed on primary producers are primary consumers. The primary consumers present in the Geelong botanic garden are grasshoppers, butterflies, caterpillars, and rodents. Grasshoppers and caterpillars feed on grasses and leaves of plants.
While butterflies feed on nectar in flowers, rodents consume seeds of the plants. Miller and Spoolman (2010) describe primary consumers as herbivores that transition the flow of energy from plants to animals. As the energy flow from one trophic level to another, it decreases due loss of energy in the process of cell respiration, waste material, and heat.
Secondary consumers such as birds are also present in the Geelong botanic gardens. Birds feed on insects such as ants, grasshoppers, caterpillars, and butterflies. Given that they are the third trophic level, the level of energy in this trophic level is significantly lower than the energy in the first trophic level. Additionally, tertiary consumers present in the garden are birds of prey such as hawks.
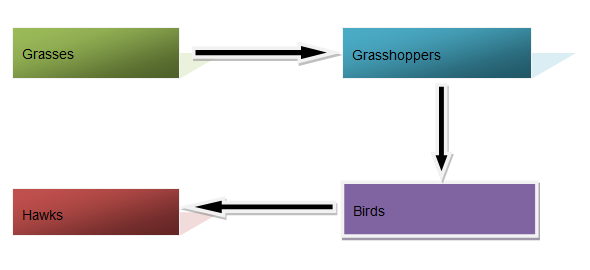
The hawks feed on rodents and birds, which are secondary consumers. In this view, hawks feed on the trophic level that has the least amount of energy in the ecosystem of the Geelong botanic garden. This means that hawks fall in the highest trophic level in the Geelong botanic garden.
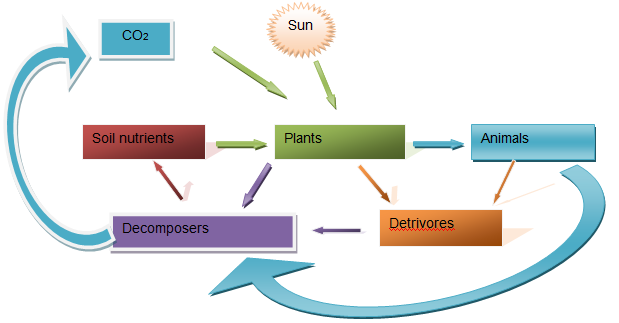
Since hawks fall in the highest trophic level, they only release their energy into the environment when they die. Detrivores and decomposes act on dead organic material and release nutrients into the ecosystem. Thus, the food chain and chemical cycling can effectively demonstrate the flow of energy in an ecosystem.
Food Chain
The following food chain illustrates the flow of energy in the Geelong botanic garden.

Chemical Cycling
The following is a chemical cycling that best describe the flow of chemicals in the Geelong botanic garden.

Conclusion
The ecosystem is an ecological system that sustains itself. It comprises of biotic and abiotic factors that interact effectively to support the existence of living organisms. Examination of Geelong botanic garden illustrates that it comprises of plants and animals that interact effectively with their physical environment.
Species area-curve of plants indicates that species richness and diversity increases with an increase in the area of habitat. This implies that the Geelong botanic garden has a homogenous environment that has even distribution of nutrients.
Diverse plants are the primary producers because they provide energy and chemicals to the ecosystem. The animals belong to the trophic levels of primary, secondary and tertiary consumers. The food chain shows that hawks belong to the highest trophic level. Comparatively, chemical cycling indicates that detrivores and decomposers play a central role in recycling of nutrients trapped in plants and animals.
References
Chapin, S, Matson, P, & Vitousek, P 2011, Principles of terrestrial ecology, Springer, New York.
Miller, G, & Spoolman, S 2010, Environmental Science, Cengage Learning, New York.
Scheiner, S, Cox, S, Willig, M, Mittelbach, G, Osenberg, C, & Kaspari, M 2000, ‘Species richness, species-area curves and Simpson’s paradox’, Evolutionary Ecology Research, vol. 2 no. 1, pp. 791-802.