Definitions
Elasticity of demand is the responsiveness of a quantity of product in relation to a price change. Unit elastic on the other hand is the relative response of one variable like commodity’s price to changes in another variable (usually the quantity).
In this case any slight or significant change in prices results to a proportional change in quantity, the percentage change in price is equal to the percentage change in quantity. Unit elastic usually acts as a marker between elastic and inelastic demand.
For a good whose coefficient is exactly equal to one, then it is referred to be unit elastic whereas for those whose coefficients of elasticity are less than or greater than one, are considered inelastic and elastic respectively. This unit elastic demand applies when a consumer has a wide range of substitute goods to choose from.
Cross price elasticity is the responsiveness of a quantity of a product in relation to the change of price of another product. Substitutes are goods that can replace another good with the same purpose. Generally purchased when price of one good is higher than the other and same benefit or purpose is realized.
Another situation is when one good is unavailable but another one is readily available, again with the same benefit or purpose. An example could be gasoline.
If a consumer prefers a higher octane, premium unleaded, but the price increases dramatically and they are not realizing a significant value for the higher octane, they could substitute for regular unleaded at a lower price. When the price of one commodity increases, the shift of consumers to a substitute is realized. (Mankiw, 1998).
Complimentary goods are goods that have a dependency and are used together. Continuing with the vehicle and gasoline examples, if gasoline, even regular unleaded continues to rise, consumers will reduce the usage of their car and reduce the limit of the gasoline purchases.
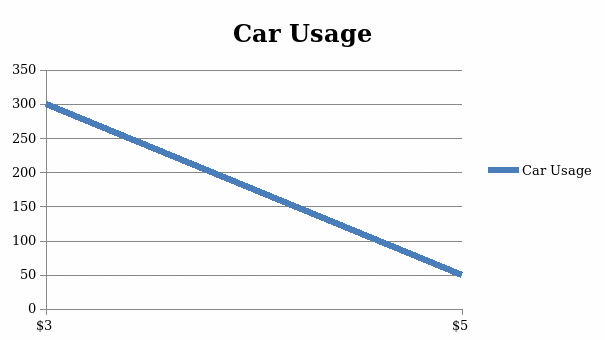
As the price rises, the demand for vehicles falls. This is depicted in the graph below in a rudimentary fashion. If the price of gasoline per gallon rises to $5.00, the mileage a person drives decreases in accordance.

Income elasticity is the change in the demand of a good to the change of disposable income of the consumers. If income increases, normal good demand will increase. When income increases, demand of inferior goods decreases. An example is paper towels.
When income is low, consumers will purchase a believed inferior good of the no-brand name paper towel. When disposable income increases, the demand for a normal good (Bounty) will increase.
Elasticity coefficients
Elasticity coefficients are the value of the relation of two variables and can be negative or positive values. If price elasticity of demand is positive, the demand of the good increases with price increases. If it is a negative coefficient the demand is affected inversely to its’ own price. A zero coefficient indicates no change in demand in relation to price.
The coefficient of income elasticity indicates the change of demand to price based on consumer actions. More income spent indicates an increase in normal good and less income spent decreases normal good demand. The opposite is true for inferior goods with a decrease in disposable income spending.
When consumer income increases products are more desirable due to affordability. If income elasticity is less than one, the product would be considered a necessity. Superior good is determined by an income elasticity greater than 1. The impact of a negative income elasticity is an inferior good; consumers perception of a lesser quality of good.
Calculations of demand provide a value that categorizes demand as either elastic or inelastic. Elastic demand receives a value greater than one. Inelastic demand is less than one. When calculating demand, it results in a negative number more often than not.
Contrast the terms in A
This information is useful to suppliers to determine the amount of good produced. Using elasticity of demand to compare the good demand to its’ own pricing. When assessing a demand change of their good in comparison to the price another similar good, cross elasticity is relevant.
While analyzing the demand of a good in conjunction with consumer income and spending, the income elasticity of demand is vital. Using all three analyses provides information for supply and forecasting production levels.
D & E. Determinants and examples of elasticity demand
Availability of substitutes: Dictates that demand is more responsive (elastic). The percentage change of demand increases in correlation to the increase of substitutions available. The more substitutes made available the tendency of consumers to select less costly goods increases.
Once there is realization of a products’ capacity in market share, the percent change in demand will stabilize. Carrying forward the example of gasoline when premium unleaded prices raise, the availability of regular unleaded must be prevalent to meet the shift of demand.
Share of consumer income devoted to a good: The share of consumer income devoted to a good impacts the goods’ elasticity. If the price of a good significantly increases and demands more of a consumers’ income, the demand for the good will decrease.
However, if the price is slightly increased and has minimal impact on the consumers’ income, the demand tends to slightly shift. If the price of a good significantly decreases, it will demand only a small share of consumer’s income and so the demand for the goods will increase.
On the other hand, an increase in consumers’ income also increases their purchasing power and hence a subsequent increase in demand for the goods and vice versa. For example, a remarkable increase in the prices of furniture will reduce consumers’ demand because of the huge share of income that will be devoted to purchasing them.
If the prices of furniture are minimally increased and hence have an insignificant impact on consumer’s income, their demand will slightly shift. If consumers’ income increases, the demand for furniture will increase proportionally.
Consumer’s time horizon: the duration of time a consumer has to analyze and find a good. The longer a consumer has to make a selection, the more opportunity (elastic) the demand.
Should any long-offered product increase in price, consumers may act negatively and demand decrease. However, if it is a newly introduced product, a price increase should have minimal impact on the demand.
For the consumer’s time horizon, the products that have been in the market for long enough and the consumers are well aware of their prices will have a drastic fall in demand when their prices are increased for example the case of desktop computers.
If their prices are increased, consumers will shy away from purchasing them and hence a decrease in their demand.
On the other side, the introduction of a new technology in the market like the case of iphones and android systems, an increase in their prices may not affect their demand simply because they are new commodities in the market and the consumers are willing to pay more for them.
4Business decisions are impacted by the various determinants of price elasticity of demand and these are: close elasticity of demand, this is the relative response of demand to changes in price of another related good.
If a business hikes the prices of its commodities, consumers will shift to other substitutes present in the market and hence the business should put into consideration the prices of other related commodities when pricing their goods.
The second determinant is the income elasticity of demand. When analyzing the demand for a good, a business should put into consideration consumers’ income and spending. If a business increases the prices of furniture for example, beyond the consumers’ purchasing power, the demand for the goods will drastically fall and vice versa.
The third determinant is consumer’s time horizon. If a business increases the prices of the new commodities in the market, their demand may not be affected as opposed to increasing prices of other commodities that have been in the market for a longer period.
So when a business chooses to increase the prices of desktop computers, their demand will automatically decrease because the products have been in the market for a while longer as opposed to increasing the prices of iphones and ipads.
Whenever the value of income elasticity coefficient happens to be positive, the good is considered normal and when negative the commodity is considered inferior. If the coefficient of a cross elasticity is a positive value, then it signifies a closely related good, where as a negative coefficient value signifies a complementary good.
Perfectly inelastic demand and perfectly elastic demand
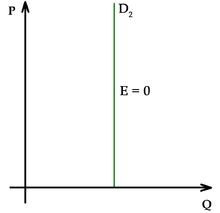
Perfectly inelastic demand depicts a change in price and no change in demand. Revenue will increase with no impact to demand.
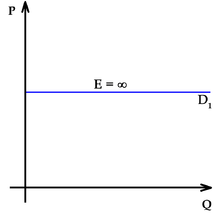
Perfectly elastic demand depicts the decrease in demand when the price is increased for the good, no matter the amount of change. The demand will drop to zero and revenue will fall.

Figure 1. Perfectly inelastic demand. Adapted from Price Elasticity of Demand.

Figure 2. Perfectly elastic demand. Adapted from Price Elasticity of Demand.
Elasticity of demand and total revenue
Total revenue is impacted by the price of a good. It can be a positive increase in revenue if the price of a good increases and demand also increases. Additionally, total revenue can increase if a perfectly inelastic situation occurs where the price increases but the demand remains the same.
However, total revenue can decrease if a perfect elasticity situation is present and when the price increases the demand for the good falls to zero. Additionally, considerations must be made for normal and inferior goods demand changes. The impact to total revenue can increase for normal and decrease for inferior if disposable spending increases; or the vice versa.
Based upon the illustrations provide, the demand is at its elastic range between the 1st and 4th unit demand. The total revenue increases for each unit of good sold as decreases in price and increases in quantity are realized.
From the 4th and 5th unit demand, total revenue was static. This range is described as the unit-elastic range where total revenue percentage change is the same as the demand change percentage.
From the 6th to 9th unit, the total revenue begins to decline with the increase in supply. This is indicative of inelastic demand.
Reference List
Mankiw, N. G. (1998).Microeconomics. New Delhi: Elsevier.
Price elasticity of demand. In Wikipedia.