Introduction
A key strategy of improving energy efficiency and reducing carbon dioxide (CO2) emissions of the industrial sector in the US. The US Department of Energy and Environment Protection Agency (EPA) pursues this strategy by providing international standard service marks or certification through the trademark of the ENERGY STAR program. ENERGY STAR is a statistical benchmarking tool embodied the Energy Performance Indicator (EPI) used to measure energy intensity (amount of energy per unit output) and energy efficiency (amount of output per unit of energy) of product-related activities such as as plant-level energy use (e.g. auto assembly plant). Assembly plants consume the most energy within the motor vehicle sector. Table 12 shows the annual energy consumption by assembly plants spent over US$441 million on electricity [49].
Table 12: Annual energy consumption by assembly plants.
Energy Consumption
Through ENERGY STAR partnership has worked with automotive companies since 2002, (see Table 13) get engaged to develop guidelines, practices, technologies, metrics, and evaluation tools for monitoring plant energy efficiency. The performance indicators can be tracked from the type of raw material used, facility, process, and industry level. Each company’s goal is to achieve best-in-class energy performance by decreasing intensity and increasing efficiency. Energy efficiency production does not generally influence production rate and product quality, it is a direct effect on lowering production costs and supports customers’ energy management efforts. Energy is used in many different process applications in assembly plants as shown in Table 14.
Table 13: ENERGY STAR partnership with automotive companies.
Table 14: Energy use in a variety of assembly plant processes.
EPA has benchmarked the energy performance of U.S. automotive assembly plants as shown in Figure 19. The Energy Performance Score (EPS) of 75 percentiles or greater than is used as the benchmark for efficient plants. Less than 30% shows that needs greater improvements in energy consumption while greater than 50%, performance improvements focus more on optimizing systems.
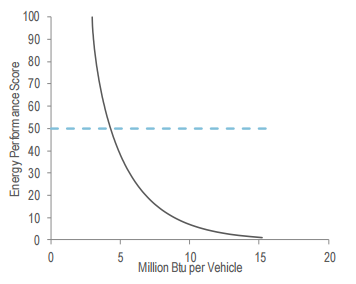
An assessment tool that provides a percentile ranking of an automotive manufacturing facility when compared with the best practices in the industry. This study analyzed the EPI stochastic model and complemented it with a gamma distribution function and loop-up macro, to retrieve the actual energy consumption data.
The energy per unit as a function of

where uiis the process inefficiency, Ei is the energy consumed, Yibeing the annual production, h is frontier-specific energy use (kWhr/vehicle) which is a function of; Iithe system inputs and β a coefficient vector to be estimated, and finally, υiis the noise in data set
To develop a percentile ranking, inefficiency must be assumed to follow some statistical distribution, which yields an EPI score given by Equation (3); where P is the probability that energy use is greater than the “best practice” level and F is the probability density function for some appropriate one-sided distribution for inefficiency.
For predicting the energy consumed per vehicle (kWhr/vehicle) from the EPI model, a gamma distribution might be used to describe the inefficiency. The result of this statistical analysis yielded two equations for electricity and fossil fuel consumption as described mathematically in Equations (4) and (5) respectively; with the WBASE being the wheelbase of the vehicle, and the Util is the facility utilization.

Microsoft Excel macro was operated using the EPI stochastic model in reverse i.e. it requires the plant rank as input to produce the energy electric and fossil-fuel consumptions and the HVAC portion. This computation quantifies the EPI ranking in terms of (kWhr/vehicle) and (MMBtu/vehicle) making it easier for production plants to assess their current consumptions (rank) in terms of actual energy expenses and to further quantify and monitor their future progress and goals. Also, the macro converts the fossil fuel consumption Fi/Yi (MMBtu/vehicle) into the total specific energy represented in (kWhr/vehicle), which is useful in translating the consumption into CO2 emissions, as will be discussed in section four.
All βi coefficients for quotations could be found in Table 2 from work by Boyd. It presents itself a description of statistical data that is obtained from 1998-2000 automobile plants survey. In the work, the utilization is defined in terms of the capacity to actual production volume.
The look-up function that is used in the given study rests on the EPI database and analyses its efficiency tables, looking for a match of the plant rank and ZIP code. The next step is comprised of the computing of the specific electric and fossil fuel energy using Equations 4 and 5 correspondingly. The suggested search subroutine also explores CDD and HDD from the Energy Star database and uses a statistic model to investigate the data. This current look-up code could be considered a Microsoft Excel Macro. It performs computation and quantifies the EPI ranking in terms of kWhr/vehicle and MMBtu/vehicle. It also contributes to the better assessment of plants’ current consumption. Yet, HVAC consumption is also analyzed to incorporate the production data and outdoor air temperature.
Macro also transfers the fossil fuel consumption Fi/Yi(MMBtu/vehicle into the specific energy represented in kWhr/vehicle.
Panel Forming Energy
The energy obtained from EPI does not belong to the panel-forming energy. This part touches upon the panel forming energy consumptions for Aluminum and steel coils. Current automobile press-lines are used

Here E states for total energy consumed in MJ, α is a rejection rate, Ek is the energy that was consumed during the process, and m is the number of processes.
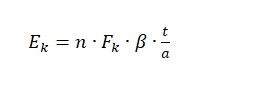
Again, n states for the number of shots needed to make the component; Fk is the force that is needed to do the cutting, β states for press velocity, t means the time needed for the operation, and a describes the number of parts per shot.
Finally, the force required for each operation is computed using Equation (8);
Fk = L·th·s
L is the length of the cut (for trimming), or the length of the draw (for drawing), this the panel thickness. s is the material strength.
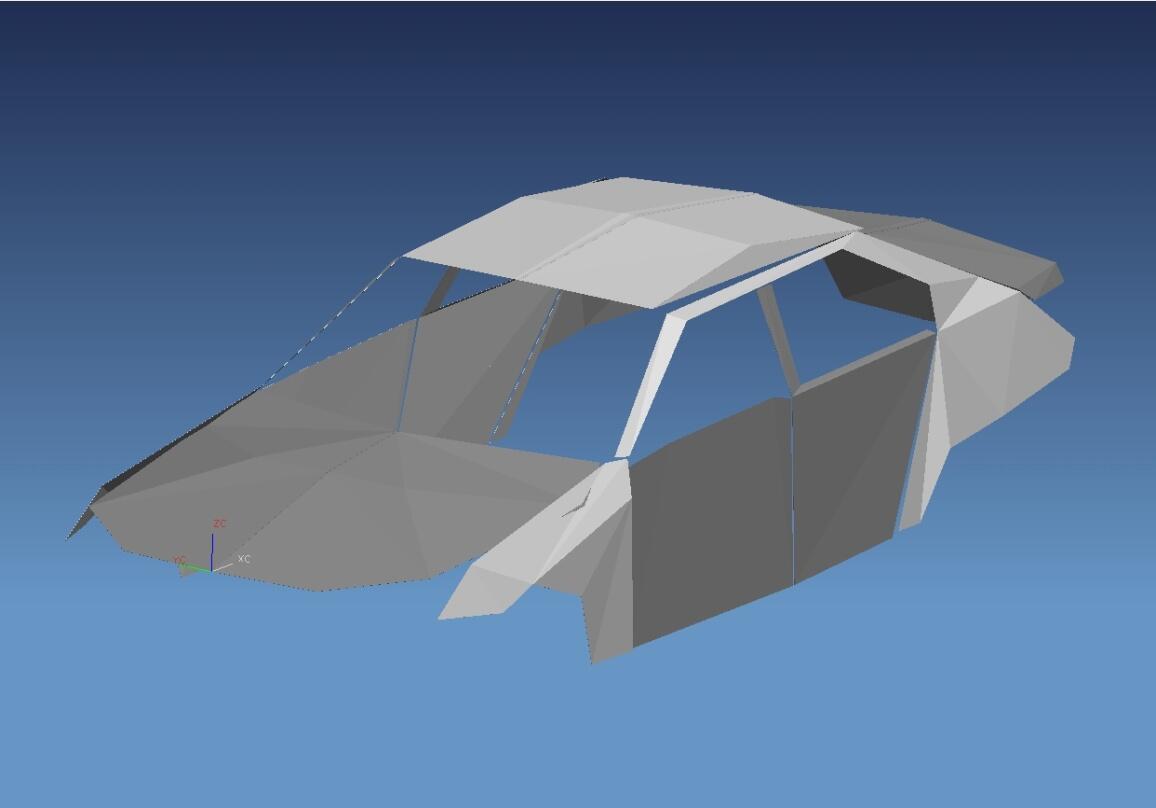
For this reason, to calculate the needed energy for the BIW panels, a vehicle structure is scanned using a Pro-T® Zeiss Coordinate Measuring Machine CMM. For Steel, a typical rejection is set 1%, and for aluminum 3%.
A Draw Quality DQ cold-rolled carbon Steel and 5052 Aluminum are used for the panels. Figure 3 shows an example calculation for the DQ Steel grade.
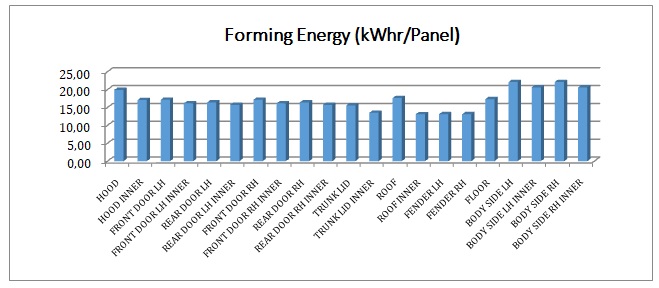
If to combine the panel forming model with the look-up macro we could obtain useful insights displayed in figure 4.
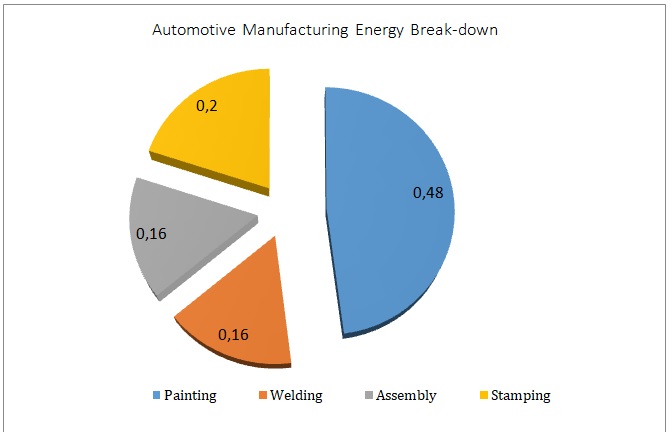
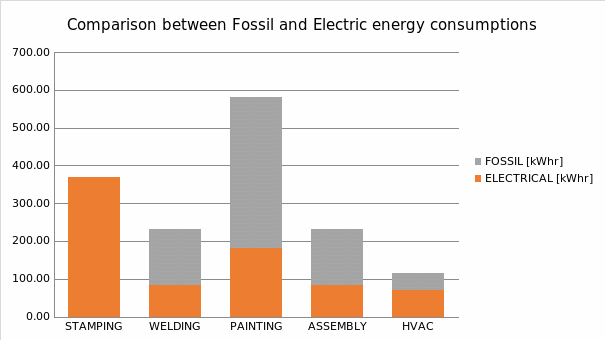
Figure 5 illustrates the results of forming models.
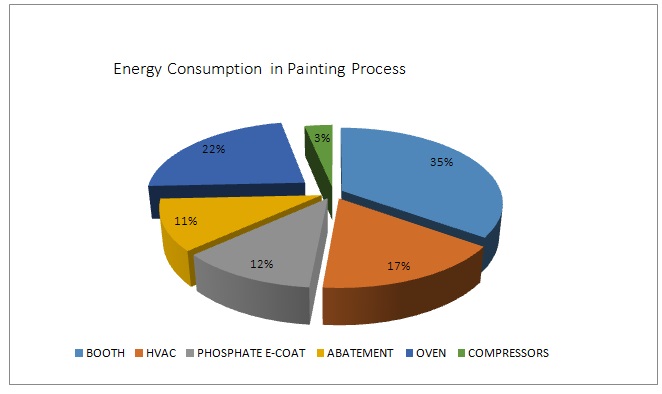
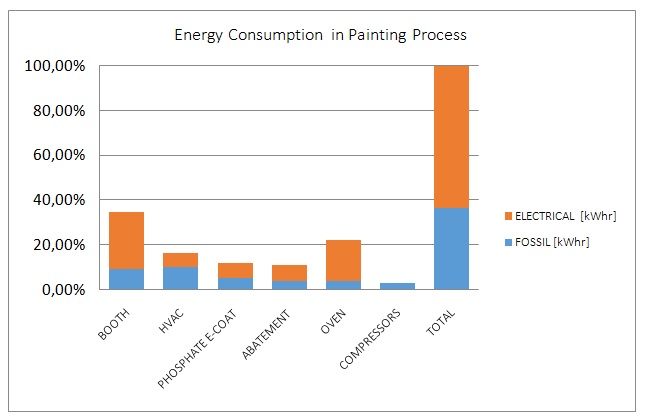
We also propose figure 6 to show the energy breakdown and figure 6b to show the detailed energy type.
Conclusion
Altogether, this study investigated the energy consumption in electric (kWhr/vehicle) and fossil fuel (MMBTU/vehicle) considering two commonly used criteria. The paper was focused on the EPU stochastic model and supported it by the investigation of a gamma distribution function aiming at the retrieving of the relevant energy consumption information. Moreover, the macro also explored the Energy Star database to obtain the HAVC portion of the facility’s total consumption. Besides, there is another new forming energy consumption model that is suggested and implemented for Steel and Al panels. This very model is also investigated through the current stamping plant surveys. The research also provides readers with the energy breakdown for the stamping process to specify the existing potential for energy savings.