Introduction
Human beings produce energy in two forms: aerobic and anaerobic. Anaerobic power is the energy stored in the body. It is accessible even without the use of energy. Utilisation of energy is through two systems: the phosphorus and the lactic acid system. In these two systems, lactic acid is highly concentrated in blood stream. Anaerobic energy is storable in muscle tissues, in the form of Adenosine triphosphate (ATP). This is a fuel that comes from the food we eat. Once the Adenosine triphosphate is up, the phosphate Creative is the one that remains in the body (Walton, 2005). On the other hand, aerobic energy is not storable in muscle tissues or any other part of the body.
Anaerobic capacity
Athletes are an excellent example for the exercise to show anaerobic endurance. They work extremely hard to improve on their anaerobic power capacity. They also work hard to reduce the dependency on it by improving their aerobic endurance. Anaerobic endurance is the ability to sustain short duration activities without oxygen. When doing anaerobic work, there is a lot of application of effort which highly demands oxygen. At this time, the muscles depend on the stored fuels. When these muscles are deprived off energy during these short activities, the resulting thing is a condition known as oxygen debt. This condition makes the body struggle to overcome it. Therefore, involved athletes are able to have anaerobic endurance in a healthy way.
Anaerobic endurance
The anaerobic activities help in burning fats that are present in the bodies of human beings. Anaerobic endurance also happens when an athlete maintains his/her pace beyond aerobic and the body goes into a debt (Brody, 2011). In this case, consumption a lot of energy is more than it can be replaced. Under this condition, the lactic acid energy does take longer to reach it when one starts slowing down. Someone with high anaerobic capacity can perform many, within short periods while one without it cannot (Maughan, 2004).
Fatigue index
Fatigue index is the method of determining energy depletion during aerobic exercise (Liu, 2008). In other words, the index sprinting test is a common way of determining fatigue index. For example, recording time for each sprint is made with a stopwatch. Anaerobic tests are to evaluate ones ability to do short duration exercises (Peng, 2011). Index number indicates the rate at which the effort used reduces. Determining fatigue index is through two tests, that is, sprinting and Wingate tests. The Wingate is the test that is used to record information in the graph.
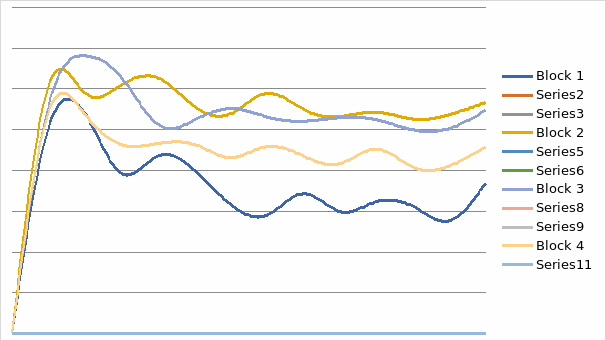
Graph showing mean power fatigue index

When one starts jumping, the pace is very low. It then increases with time. At the end, it reduces due fatigue. This is a result of oxygen debt which demands for oxygen.
This test is of value for those who participate in long jumps since what counts is the longest length. Wingate test helps in improving people’s anaerobic capacity. Also, it helps in making the body become active. Therefore, Wingate test helps in reducing obesity which causes death eventually if nothing is done about it. The only disadvantage is that the participants lose a lot of weight during exercises. This test results to overworked bodies of the participants.
The three trails are to make the participants tune the body and get ready for the test.
References
Brody, L. T., & Hall, C. M. (2011).Therapeutic exercise: moving toward function (3rd ed.). Philadelphia: Wolters Kluwer/Lippincott Williams & Wilkins Health
Liu, R., Yang, D., & Lu, J. (2008).Plan, build, and manage transportation infrastructure in China proceedings of the seventh International Conference of Chinese Transportation Professionals (ICCTP) : May 21 and 22, 2007, Tongji University, Shanghai, China. Reston, Va.: American Society of Civil Engineers
Maughan, R. J., & Gleeson, M. (2004).The biochemical basis of sports performance. Oxford: Oxford University Press.
Peng, Q. (2011). ICTE 2011 proceedings of the Third International Conference on Transportation Engineering : July 23-25, 2011, Chengdu, China. Reston, VA: American Society of Civil Engineers.
Walton, R. (2005). World Water Congress 2005 impacts of global climate change. Reston, Va.: American Society of Civil Engineers.