Abstract
This paper demonstrates use of real financial data in financial analysis. The objective is to carry out a broad financial analysis for an actual company. It explores the various techniques and tools used for financial analysis. In the analysis, we use financial data for Bayer AG for five year period from 2006 to 2010. The study is based on comparative analysis of historical data of the Corporation.
The study concentrates on the statistical highlights of the Corporation, ratio analysis (ratios on profitability, liquidity, safety and efficiency). In addition, percentages are used in the analysis to monitor changes overtime. Graphs are also used to portray trend of various variables in the study over the five year period. Finally, the results are interpreted based on ideal situations and recommendations are made based on the findings
Introduction
Bayer AG is a multinational company dealing with pharmaceutical products with its head office located in Germany. Vast proportion of returns on sale comes from pharmaceutical segment. From 2005 to 2010, series of financial performances characterize operation of Bayer AG Company especially on the periphery of ratio performance.
Over this period, there has been no substantial change in capital structure in the operations of Bayer AG Company. Bayer AG has market across the world with substantial segment in America, Europe, Asia, and Africa. Specifically, in 2007, this segment generated over $ 50 million in sales which is 49% of total sales (Bloomberg Business 02).
Indicated below are figures representing financial performance of Bayer AG Company for a six year interlude from 2006 to 2011.
Summary of financial feat from 2006 to 2011
Table 1
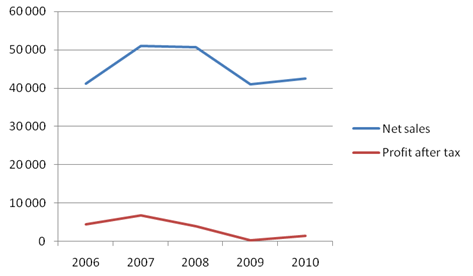
From the figure given above, performance across the six year period was erratic. However, no loss was reported in any year. The sales were at its highest in 2007 and lowest in 2009. Despite steady dividend per share averaging to 1, earnings for the same performed dismally.

Key:
- Horizontal axis-years.
- Vertical axis-sales.
Scope and Objective of the Study
This paper attempts to comprehensively and explicitly analyze financial statements of Bayer AG Company covering performance in sales from 2006 to 2010.
In summary, the paper will present an inclusive location of Bayer AG on the facets of financial position as part of liquidity, profitability, and efficiency. In addition, the treatise makes informed suggestions and predictions into the future survival analysis of the company based on the findings from the study.
Literature Review
Bayer AG Company makes audited comprehensive financial reports after every twelve months, that is, annually. This is in line with stipulated laws for review by government, stakeholders, and creditors, among others. Well audited financial statements are essential as they reveal a narrow reflection on weakness and strengths of the business (Clauss 19).
Thus, in order to give a comprehensive financial performance over a period of time, an in depth financial analysis is vital in managing relations between different entities and giving informed information for proper and adequate decision making science.
Ratio Analysis
The process of financial analysis involves the science of evaluating finance-related variances that facilitate in-depth determination of investment viability and sustainability both in short and long term. Intrinsically, financial statements are reviewed for a company to establish the stability, liquidity, solvency, and profitability to perform within the dynamics of business environment.
The focus in financial analysis concentrates on change in equity statements, cash flow statements, and financial position statements (Vance 34). As a tool for financial analysis, ratio analysis is important as it entails an entity’s previous, present, future extrapolation based on results obtained. In inferring and forecasting into the future performance, the aspect of money having a definite time value is factored in at every analysis level.
Profitability Ratio
By definition, this concept refers to the ability of a company to sustain growth and earn income in long and short term. Ratios used in this analysis include operation profit, gross profit, net profit, ROE (Return on Equity), and (ROA) Return on Assets. Profitability at Bayer AG is analyzed via in-depth review of expenditure and income account.
Series of simultaneously functioning ratios are computed to present the company’s profitability in the six year financial performance period from 2006 to 2011. As presented below, this table presents a comparative profitability analysis of Bayer AG over the six year financial period.
Table 2
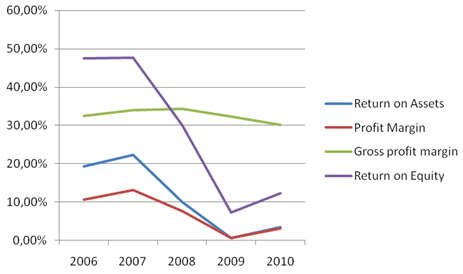
From data in the above table, the analysis computes ROE, ROA, net profit margin, and gross profit margins. These ratios indicate depreciating profit apart from the year 2007. However, the margin for gross profit is relatively stable implying a proper inventory control, efficiency in production, and sustainable pricing policy to offer comparative advantage.
In addition, the margin for net profit is relatively unstable probably due to the economic climate on the late last decade, inability to generate adequate revenue on sales to cushion fixed costs and eventually stabilize profitability margin. Besides, it is vital to note that ROE and ROA vary as net profit margin changes from time to time (Clauss 81).
The declining performance can also be attributed to global financial instability, weaker corporate and customer spending, volatility in currency market, and limited credit availability. However, change in strategy could be attributed to performance in 2007, and that of 2010 through to 2011. Illustrated below are the graph and table reflecting varies in profitability and trends in ratios.

Key:
- Horizontal-years.
- Vertical-percentage.
Liquidity ratio
Liquidity ratio is vital in establishing the strength of a company to maintain and sustain positive cash flow within the range of immediate obligation satisfaction of settling debts (Vance 56). In order to compute this ratio, the analysis dwells on liquid assets or cash flow.
The concept of liquid asset refers to trade in market that is active and is easily convertible into cash and the current best price in the market. The techniques employed in this analysis include the quick and current ratios. The table below presents the outcome of the analysis.
Table 3
Values obtained indicate current ratio for Bayer AG ranging from 1.7 t0 1.0 across the period of analysis. From this performance indicator, it is apparent that Bayer AG has a strong liquidity ratio and is within the boundaries of the 2:1 ideal current ratio.
Safety
This concept reflects on vulnerability of an organization to uncertainty or the risk factor and the magnitude of protection in place for debts in the business (Helfert 38). Series of simultaneous ratios can be employed to reveal the current state of safety in Bayer AG Company. Among the techniques include Debt to Equity ratio. The results are displayed in the table below.
Table 4
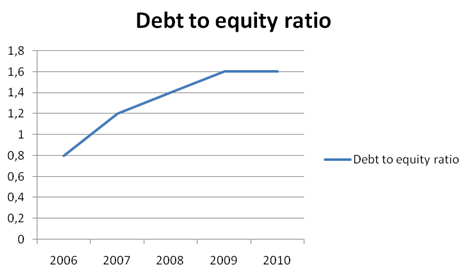
The ratio of debt to equity affirms the quantitative interaction between creditors’ funds and investment by investors and owners in terms of capital. Reflectively, a higher ratio of the same directly translates into higher risk to both present and prospect creditors. In comparison, the smaller the ratio, the lower the cumulative risk on present and future investments.
Therefore, lower rations translate into financial stability and predictable probability to be financially worthy to borrow at present and latter (Vance 67). However, extreme low figure in the ratio is an indication of excessive precaution and conservativeness. As showed in the graph below, this ratio changes from 0.8 in 2006 to 1.59 in 2010. The positive changes indicate higher risk to present and prospect creditors.

Efficiency
This ratio indicates the management science and how appropriate they are in resource use to generate income and sales. As reflected in the turnover ratio, efficiency analysis also indicates the activity level. In this analysis, account payable, and account receivable turnovers are intrinsically employed simultaneously (Clauss 38).
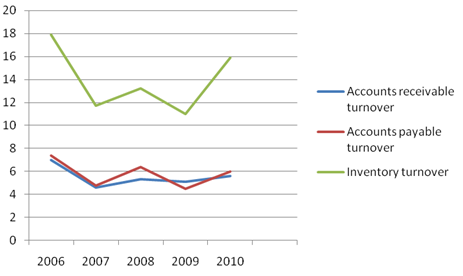
These computations are presented in the table below. From the data generated, it is clear that the performance on this grid is erratic. This is because both positive and negative variations are noted across the six year period. Therefore, predictability of the future may not be accurate when account payable and account receivable turnover ratios are used. This is indicated in nature of graph generated.
Table 5
Notably, sales to total assets and that of net worth declines across the years. As an indicator, sales to net worth reveals the number of units of sales achieved for every unit bundle of investment. On the other hand, sales to total assets show how efficient the company realizes sales for every unit of its assets.
Therefore, it a measure of the ability of a company’s assets to efficiently and sustainably generate sales in short, mid, and long terms (Helfert 34). As indicated above, Bayer AG’s ability to realize sales form assets and noteworthy is unreliable and is on declining trend. Unfortunately, this trend has a negative effect of lowering the confidence of investors to invest their capital in short term especially if the motive is partially speculative.

Methodology
In the process of carrying out the comprehensive financial analysis, financial statements of Bayer AG Company were reviewed for a six year period from 2006 to 2011. This analysis employed varies analysis tools such as liquidity, profitability, liquidity, capital structure, and percentage.
These techniques and tools were employed simultaneously in cash flow, financial, and income statements (Helfert 56). Outcome from these techniques were extrapolated and explained and use in forecasting into future.
Conclusion
Depending on the structure of a company, financial analysis can sometimes be tricky. Since Bayer AG fall in different industry in terms of product orientation, analysis of its financial statements is complex. This industry of operation is competitive. Thus, decision making science should resonate on the periphery of accounting science and qualitative analysis of data derived from financial performance.
From the analysis discussed above, it is apparent that Bayer AG Company has performed relatively well especially on the facets of sustainable business operations. Reflectively, the 2007 financial year was outstanding. This better performance can be attributed to strategies aimed at facilitating financial turnaround.
In the six year financial period of analysis, Bayer AG has been able to meet obligations and beyond. As noted, current performance in finance alone cannot extrapolate forecasting into future sustainability due to series of inconsistencies in previous performances. In addition, the current financial ground may not paint out a clear future for shareholders for short term investment profitability (Brigham and Houston 121).
However, due to a compact structural system, investment in the long run is viable within the operations of Bayer AG Company. Therefore, before further capital injection, further review should be ascertained as a function of present trend in profitability and sustainability.
Works Cited
“Bloomberg Business: Bayer AG-REG (BAYN:Xetra).” Investing.Businessweek.com. Bloomberg Businessweek. 2010. Web.
Brigham, Eugene F. and Joel F. Houston. Fundamentals of Financial Management. 12th ed. USA: South-Western Cengage Learning, 2009. Print.
Clauss, Francis J. Corporate Financial Analysis with Microsoft Excel. New York: McGraw-Hill Companies, Inc, 2010. Print.
Helfert, Erich A. Financial Analysis, Tools and Techniques: Assessment of Business Performance. New York: McGraw-Hill books, 2001. Print.
Vance, David E. Financial Analysis and Decision Making: Tools and Techniques to Solve Financial Problems and Make Effective Business Decisions. New York: McGraw-Hill Books, 2003. Print.