Sainsbury’s is one of the largest supermarket chains in the UK. In retail, financial indicators are fundamental, namely, control over them, which allows adequate planning, assessing the company’s current state, and monitoring the dynamics at the level of the entire industry compared with competitors. This paper analyzes this company in various areas and groups of indicators: profitability, liquidity and efficiency, and long-term financial stability. For each of the groups, key relationships were calculated and evaluated over four years, as well as in comparison with competitor Tesco, which is a larger retail chain. This work aims to understand the company’s trends from information obtained from open sources, such as annual reports.
Introduction
J Sainsbury PLC is a retail chain operating in the retail sector. This area of business has been featured in financial data analytics. Firstly, with a sufficiently high turnover, companies have a low gross margin, indicating the need to purchase goods from manufacturers instead of their production facilities constantly.
Secondly, the turnover of assets is one of the most critical indicators that demonstrate the organization’s effectiveness in purchasing and selling the best-selling units. Given the broad diversification of retailer product lines, the positive dynamics in this indicator are obtained in complex ways, including ABC and XYZ analyses, big data technologies, and even artificial intelligence (Cao, 2021).
Finally, retail is entirely dependent on the end-customer segment, which, in turn, most acutely perceives all severe external factors. The current ones include the economic consequences of Brexit, the pandemic, ineffective tax policies and frequent changes in power, potential recessions due to the geopolitical situation in Europe, and much more.
Analysis
The dynamics of profitability indicators show a decline and recovery over four years from the pandemic. Similar indicators can be observed in the company’s main competitor – Tesco, where even the gross margin acquires the same values over time (J Sainsbury, 2020; Macrotrends, 2022). A decrease in sales caused these dynamics with a loss in their growth rates, but with increased or remained at the same operating expense level. In addition, reliance on manufacturers increased significantly during this period as supply chains were disrupted due to lockdowns (Aday & Aday, 2020). At the same time, logistics costs increased, and many companies resorted to short-term lending, as evidenced by increased current liabilities and borrowings (J Sainsbury, 2022).
However, a significant increase in operating profit in 2022 offsets these problems through returns and growth in gross margin and return on capital employed. The delayed effect of this externality was experienced by total assets when stores were forced to close, or unsold inventory was destroyed, while administrative costs remained at the same level, which also significantly affected operating profit (Aday & Aday, 2020; J Sainsbury, 2022). As a result, increased growth rates are observed in 2022, which will naturally fall in the future, provided that there is no influence of pandemic effects. Chart 1 shows the potential growth forecast starting from 2019, described by a quadratic function.
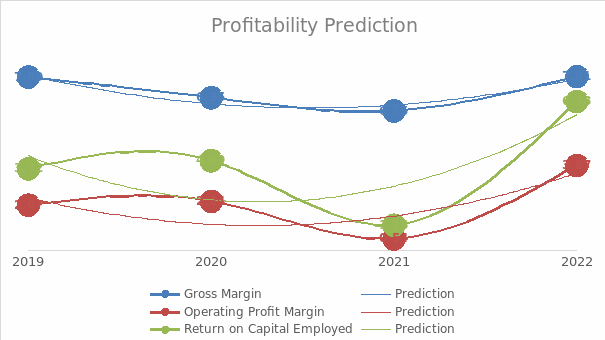
Although this function does not consider slower growth rates, it can be seen that due to increased assets, the return on capital employed will grow the most, indicating a better use of resources by companies. This is partly true, as the rapid development of technology allows for the optimization of operations on a large scale (Cao, 2021). At the same time, the gross margin will remain approximately at the same level, which is typical for the retail area.
Sainsbury’s liquidity also suffered naturally in the 2020-2021 period, which is reflected in the current ratio. At the same time, current assets in the form of cash and its equivalents increased due to lending, manifested in a significant increase in the quick ratio for 2021, with Tesco using a similar mechanism to deal with the crisis (Macrotrends, 2022). Long-term unsold inventory stocks increased by 2020-2021 due to reduced purchasing power, and then a gradual return began. Large values of this indicator are undesirable for retail, as they create a lot of unprofitable assets, distorting demand analysis mechanisms (Chuang, Oliva, and Heim, 2019).
At the same time, accounts payable collection periods had a short-term effect, in contrast to long-term assets: in 2020, the indicator increased significantly due to the crisis and began to return only by 2022 (J Sainsbury, 2020; J Sainsbury, 2022). Likewise, the period of payables decreased in times of crisis. However, the dynamics of changes are insignificant, despite the relatively short periods characteristic of retail – in just over a year, companies began to correct statistics, as evidenced by the example of Tesco (Macrotrends, 2022). The construction of a similar prediction in Figure 2 shows a trend towards recovery and constant normalization with a trend line of a higher order than quadratic.
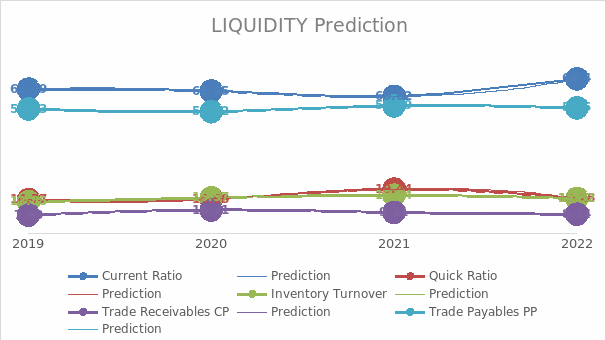
Third-order trend lines generally reflect the goals of any retail company. Inventories should be reduced to the maximum optimal, and the current ratio should grow in the future due to the growth of current assets. However, it can be seen that the quick ratio is declining noticeably, which is dictated by disproportionately high growth in 2021.
Receivables collection times will increase, but there is a mathematical explanation for the increase in the current environment of uncertainty caused by the combined impact of the geopolitical situation in Europe and disrupted supply chains for specific products. Likewise, the payables term will fall, which means more complex financial conditions for Sainsbury going forward. The question is whether the company will be able to optimize the profitability of the trend in Figure 1 enough to offset the upcoming difficult market situation in the future.
Here, it is immediately worth noting the potential obstacles. The growth of current assets was, among other things, caused by increased inventory, which makes this item relatively unprofitable for retail companies, which, as a rule, focus on perishable products. At the same time, essential assets, like cash and cash equivalents, sank significantly in 2022, even compared to 2020 (J Sainsbury, 2022).
Consequently, the organization has reduced resources for activities with long-term benefits, which is reflected in the cash flow from investing activities, where the cost of buying property has decreased, but at the same time, income from the sale has increased (J Sainsbury, 2022). However, there is a significant increase in the purchase of intangible assets, which can be a solution to this problem with proper management and optimization of business processes.
The stability of retailers like Sainsbury is always more dependent on loans than investments. At the same time, a significant amplitude of dynamics in the interest cover ratio with relatively stable growth in interest rates indicates uncertainty in long-term planning. Sainsbury’s was 0.44 in 2021 and then exploded to 3.59 in 2022 (J Sainsbury, 2022). The impact of the pandemic crisis can describe this process, as well as high costs with a long-term effect in 2021 and a return to EBIT growth in 2022.
In fact, it is almost impossible to build a good forecast in this situation at the mathematical level; however, if the current influence of external factors persists, the situation will soon stabilize to the level of 2019 and then show the jumps again. Tesco, due to the greater degree of consistency in operating income and general financial capabilities, was able to maintain the dynamics at the level of gearing – there were minor deviations in 2020-2021 (Macrotrends, 2022). In the long run, Sainsbury loses stability, and much will be decided by the company’s development activities in the coming years.
Conclusion
This analysis showed that J Sainsbury has generally weathered the crisis of 2020 with dignity, as indicated by the profitability indicators by 2022. This advantage against the background of the loss of liquid assets is the company’s ability to maintain competitiveness and share in the retail market. Forecasts show disappointing scenarios that are consistent with the current situation in the world.
However, despite a more stable development from the main competitor, Tesco PLC, Sainsbury has sufficient financial leverage and long-term assets to overcome these difficulties, but much depends on the organization’s optimization and management processes. Generally speaking, Sainsbury moved away from the market leaders in the face of the crisis but performed well enough in the short term to overcome it, maintaining a reserve of potential for future development.
Calculations
Profitability
- Gross Margin = Gross Profit / Revenue
- Operating Profit Margin = Operating Profit / Revenue
- Return on Capital Employed = Operating Profit / (Total Assets – Current Liabilities)
Liquidity & Efficiency
- Current Ratio = Current Assets / Current Liabilities
- Quick Ratio = (Cash and Cash Equivalents + Accounts Receivable) / Current Liabilities
- Inventory Turnover = Cost of Goods Sold / Average Inventory
- Trade Receivables Collection Period = Accounts Receivable / Revenue * 365 days
- Trade Payables Payment Period = Accounts Payable / Revenue * 365 days
Long-term Financial Stability
- Gearing = Long-Term Liabilities / (Total Assets – Current Liabilities) * 100%
- Interest Cover Ratio = Operating Profit / Interest Expense * 100%
Reference List
Aday, S., and Aday, M. S. (2020) ‘Impact of COVID-19 on the food supply chain’, Food Quality and Safety, 4(4), pp. 167-180. Web.
Cao, L. (2021), ‘Artificial intelligence in retail: applications and value creation logics’, International Journal of Retail & Distribution Management, 49(7), pp. 958-976. Web.
Chuang, H. H. C., Oliva, R., and Heim, G. R. (2019) ‘Examining the link between retailer inventory leanness and operational efficiency: Moderating roles of firm size and demand uncertainty’, Production and Operations Management, 28(9), pp. 2338-2364. Web.
J Sainsbury. (2020) ‘Annual Report and Financial Statements 2020’. Web.
J Sainsbury. (2022) ‘Annual Report and Financial Statements 2022’. Web.
Macrotrends. (2022) ‘Tesco Financial Statements 2009-2022 | TSCDY’. Web.