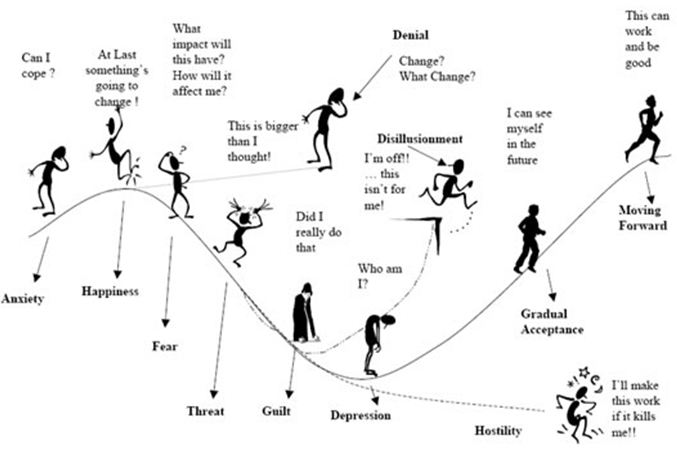
Fig1: Fisher, John.The Process of Transition (Fisher’s Personal Transition Curve)
This diagram illustrates a figure described as the transition curve (Fisher 1). I choose this diagram over other arts because it portrays the different phases that people undergo through when they meet considerable changes in their professional, communal, or personal lives. The above transition representation can be practical to the organizational level when changes are initiated.
As indicated in the diagram, an individual usually encounters feelings of anxiety when change is initiated (HBR’s 10 must reads on change management 11). Thereafter, an individual comes to the stage of denial.
During this stage, individuals must come up with their conclusions to lessen the discord witnessed at the first phase. The subsequent stage leads to better understanding of an individual’s real level of competency relative to the essential level (Fisher 1).
The lowest stage illustrates the point that an individual’s confidence and competence are at their lowest levels (Fisher 1). After this, an individual will recognize and embrace the realities brought by the changes (Gallos 56).
A person taking the rights of his or her newly attained behaviors depicts the last stage. As a result, the person enhances his or her self-esteem and competence to an advanced level than at the start.
Works Cited
Fisher, John. The Process of Transition (Fisher’s Personal Transition Curve).6 Sept. 2012. Web.
Gallos, Joan V.. Organization development: a Jossey-Bass reader. San Francisco, CA: Jossey-Bass, 2006. Print.
HBR’s 10 must reads on change management.. Boston, Mass.: Harvard Business Review Press, 2011. Print.