A fishing rod requires guides for the line so that it does not tangle and so that the line casts easily and efficiently. In this task, I will develop a mathematical model for the placement of line guides on a fishing rod.
Leo has a fishing rod with overall length 230 cm. The table shown below gives the distances for each of the line guides from the tip of his fishing rod.
Variables and parameters/constraints
The given data is the guide number from the tip of the fishing rod and the distance from the tip of the fishing rod. Since the guide number is an independent variable that should be taken along the X axis for plotting, and the distance along the Y axis. It is impossible for there to be a negative number of guides or a negative distance, therefore the guide number or the distance from the tip of the fishing rod cannot be negative. This means the whole graph should be restricted to the first quadrant.
The above data is plotted on the graph below:
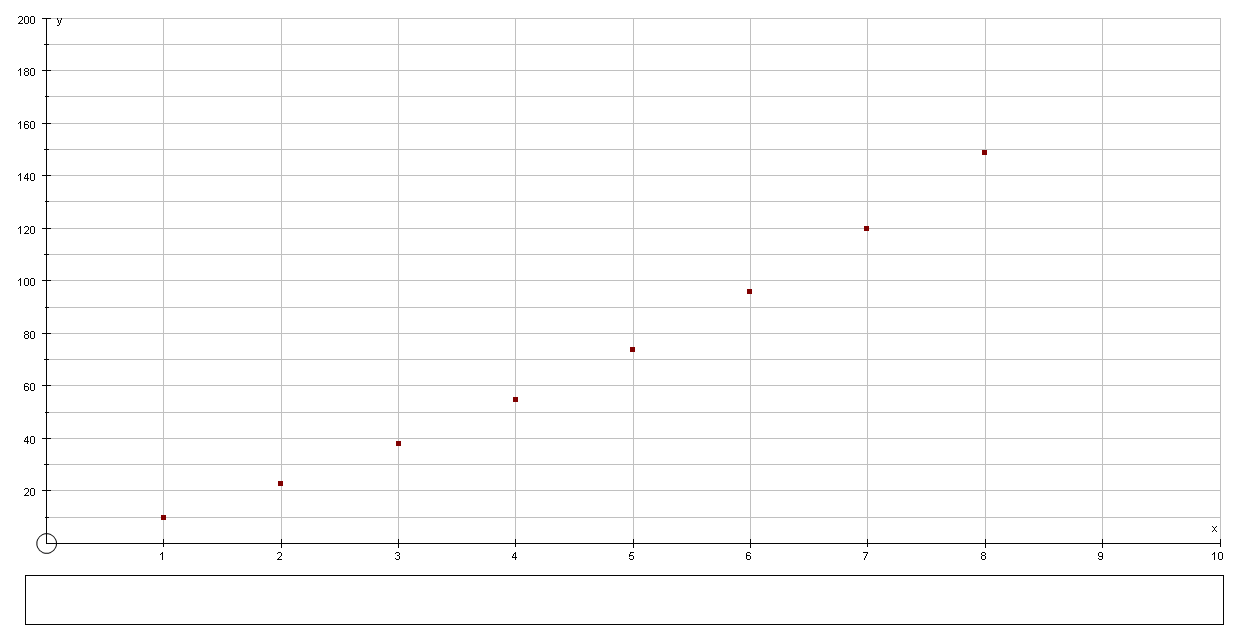
From the graph it is clear that there is no linear relationship between the guide number and the distance from the tip. The relation between the guide number and the distance from the tip of the fishing rod can be a quadratic or a cubic function.
Quadratic function
The given data is entered in the GDC in two columns L1 and L2 and an equation for the quadratic regression equation is found out.
The input data in the TI 84 Plus
The quadratic equation
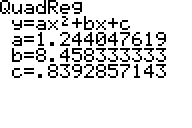
The values of a, b and c are corrected to 3 decimal places.
So:
- a= 1.244
- b = 8.458
- c = 0.839
The general quadratic function is y = ax2 + bx + c, and can be written as:
Y = 1.244x2 + 8.458x +0.839
The graph of the above equation is
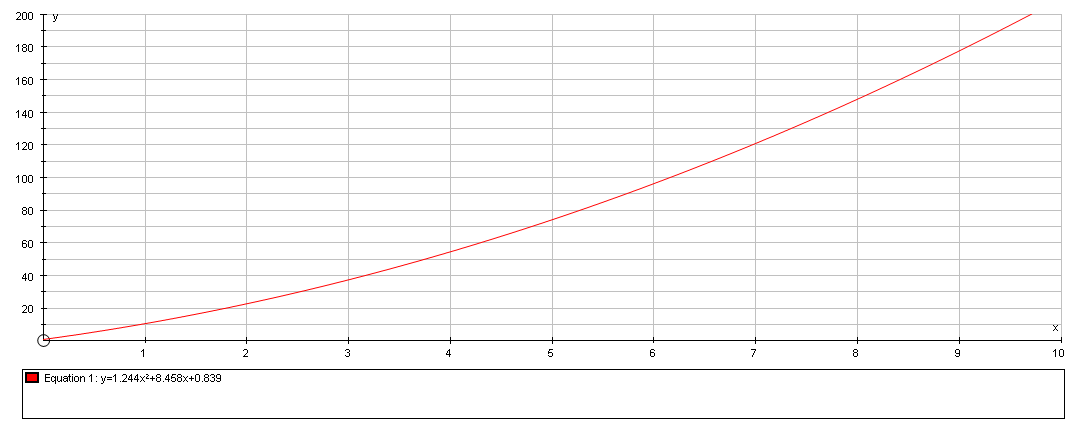
Graph obtained from the GDC
The table of values of the quadratic equation where X represents the guide number from the tip of the fishing rod and Y1 is the distance from the tip of the fishing rod in centimeters.
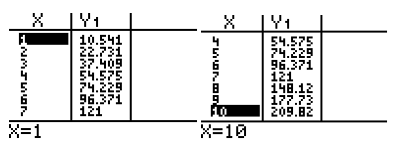
A comparison of the data given and the values obtained from the equation is represented below in a tabular form and the mean of the differences of the two values are calculated to verify how close the obtained values are from the real one.
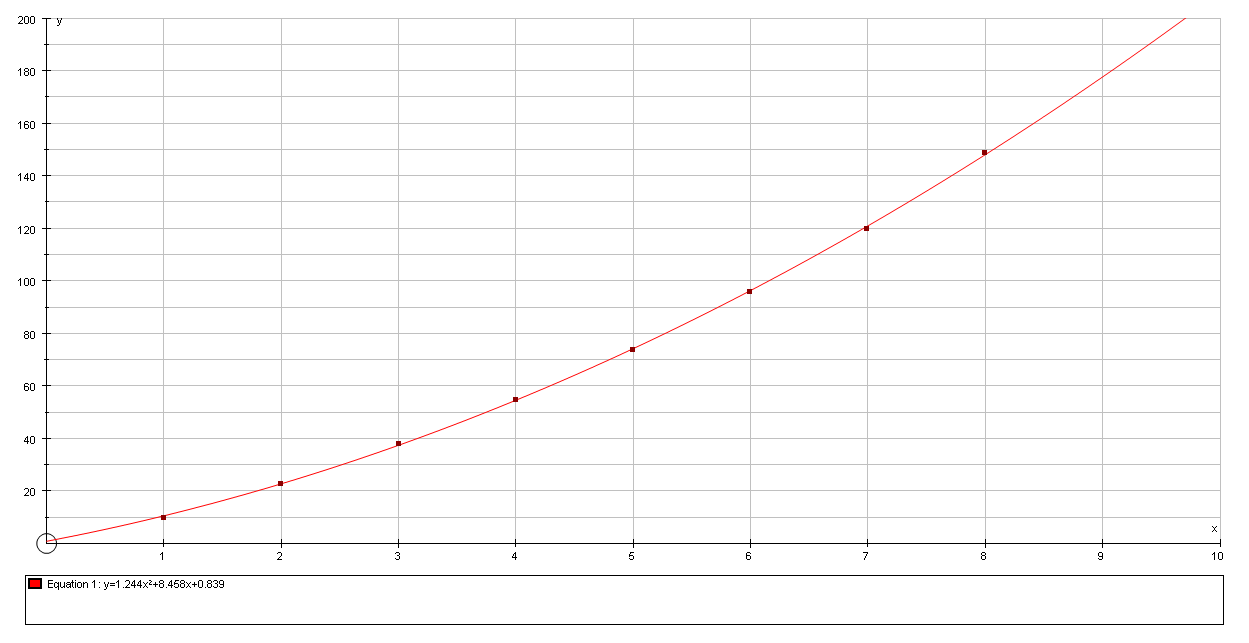
Combined graph (given data and the equation):
Cubic Function
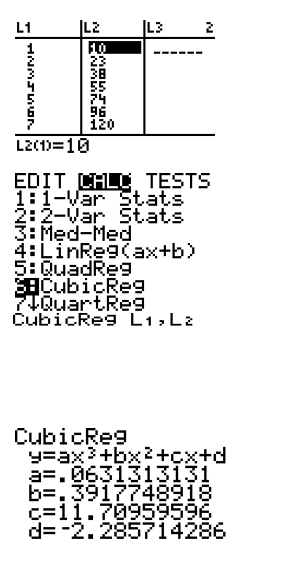
The cubic equation is y = 0.063x3 + 0.392x2 + 11x -2.286
The graph of the cubic function:
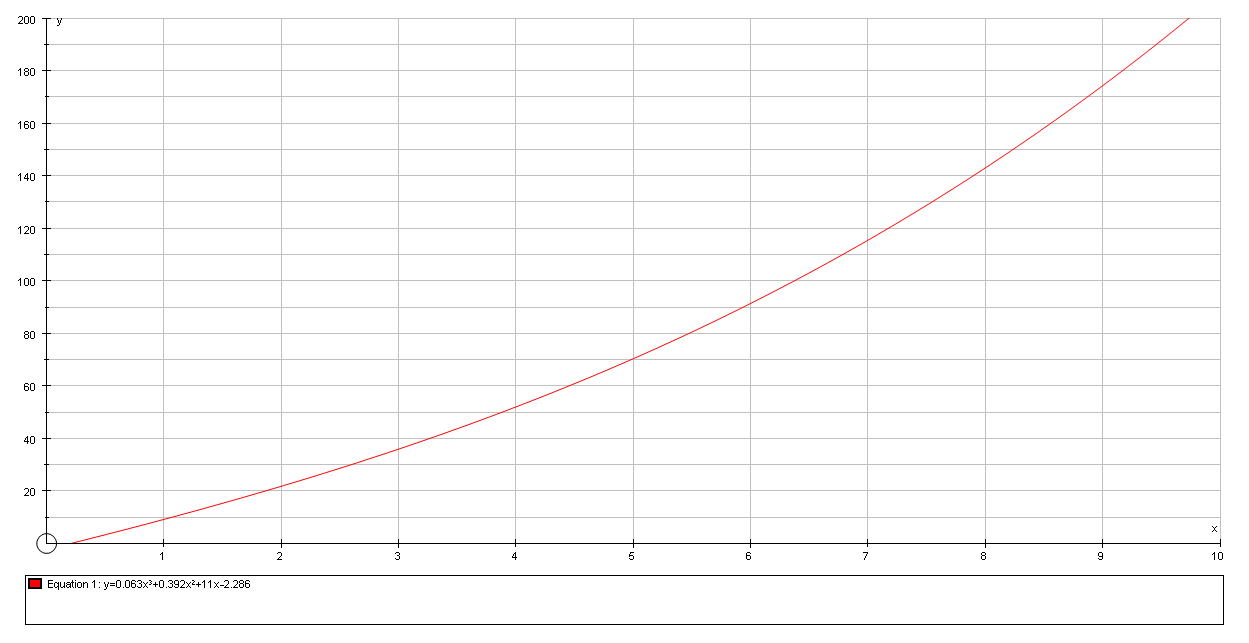
Table of values

Combined graph of the given values and the cubic equation
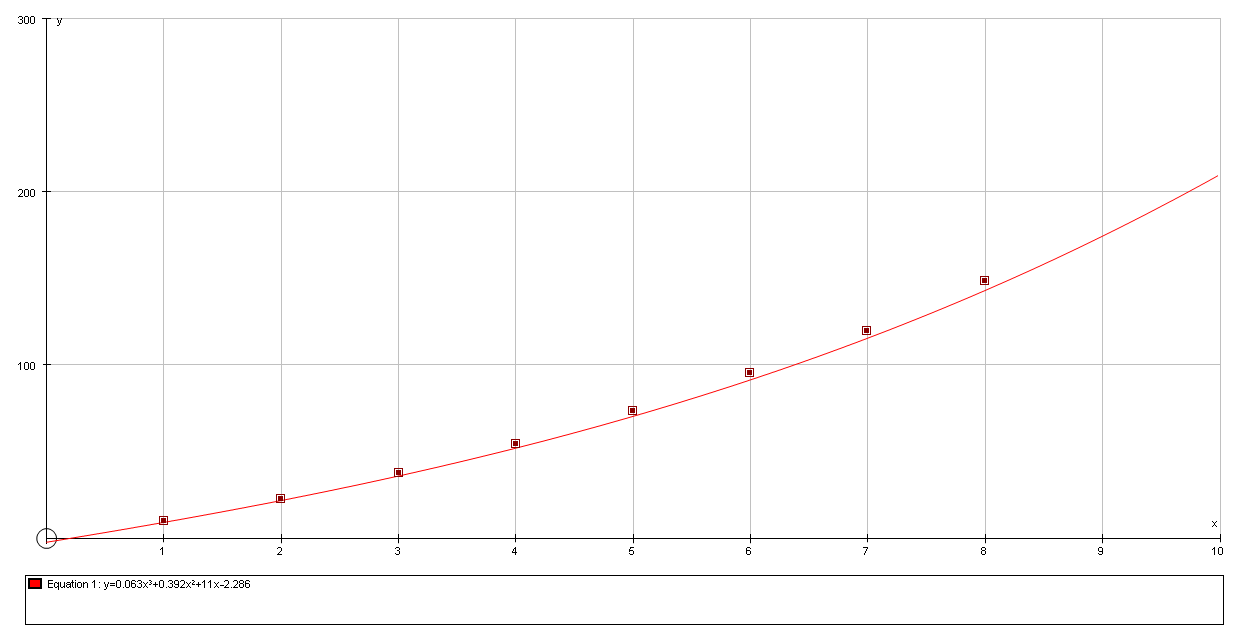
From the graph and the mean of the difference in the original values and the values from the equation of both cubic and the quadratic it is clear that the quadratic function is more appropriate. This is because the mean of the difference in the cubic function is higher. This means that the values obtained from the cubic function is not that much closer to the original values.
Mark has a fishing rod with overall length 300 cm. The table shown below gives the distances for each of the line guides from the tip of Mark’s fishing rod.
The graph of the above set of values is as follows:
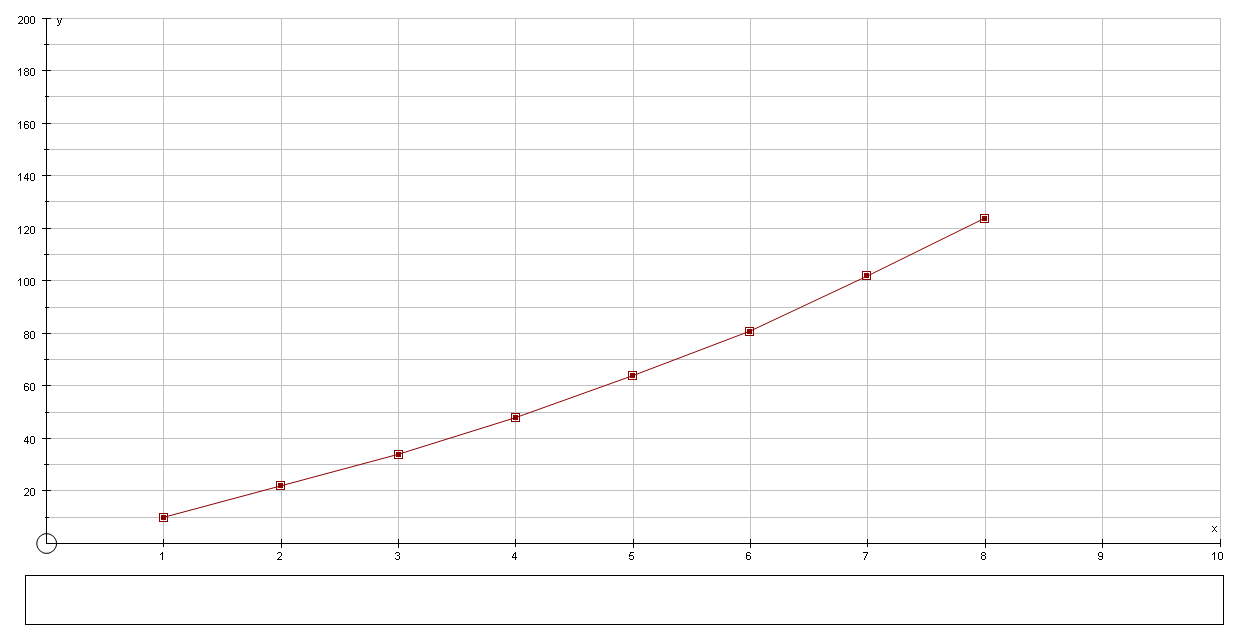
To find the quadratic function for the given set of values, the GDC is made use of.
The steps are as follows:
Enter the data in the GDC in two columns (L1 and L2)

The quadratic equation is the following:
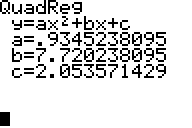
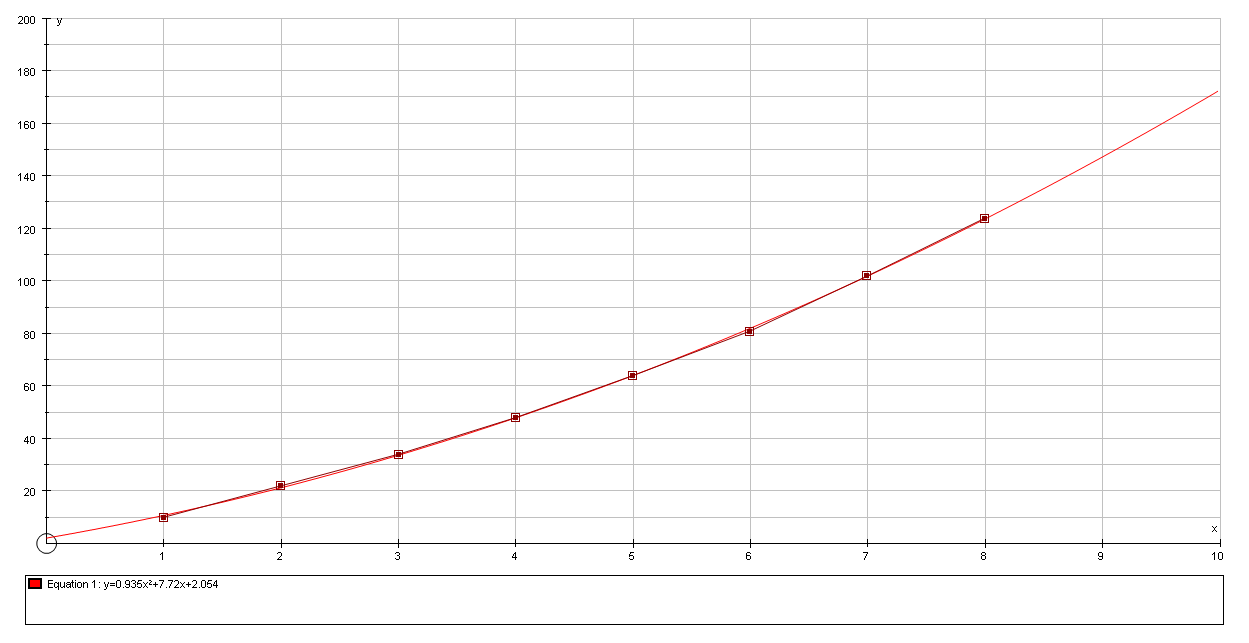
The quadratic model is y = 0.935x2 + 7.72x +2.054
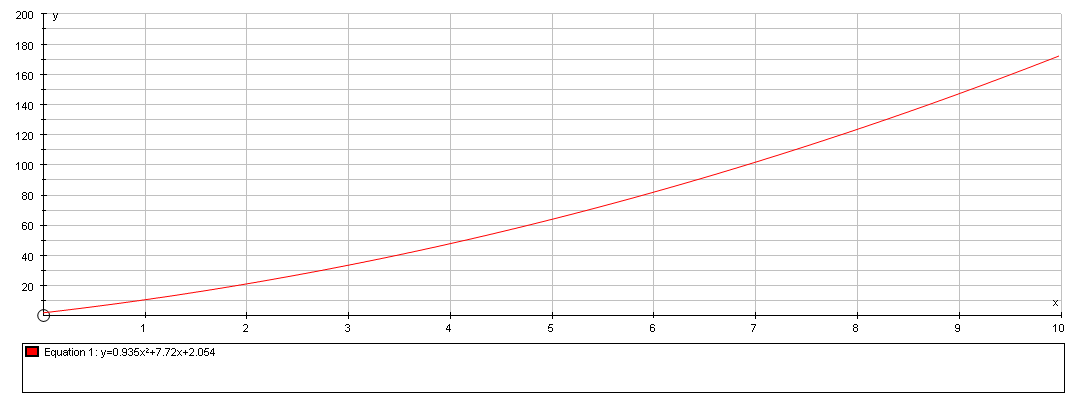
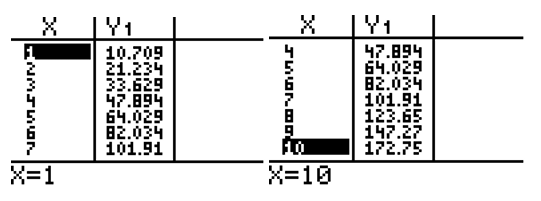
A combined graph of the given data and the new equation:
You are to explain each process I did in words [go back and above each graph or table, explain what you are doing]
Then, answer the below questions. Answer them directly where I stopped.
– Which of your functions found above best models this situation? Explain your choice.
My choice will be quadratic model since the fit is perfect, which is obvious from plotting graph of actual and estimate, and the average of errors is far lower as compared to cubic model.
Since the given data is modeled almost perfectly by quadratic equation, the same can be used for adding further guides after considering the length of the fishing rod.
The model fits the data and need not necessarily for data collected from various rods, though with same length. So this model can be used with caution and empirical study should not be ruled out.
– Use your quadratic model to decide where you could place a ninth guide. Discuss the implications of adding a ninth guide to the rod.
I would place a ninth guide at 178 cms away from tip. It fits well in the quadratic model. The only implication of adding ninth guide to the rod is that as the distance from the tip increases, it is going to be closer to the handle which might affect fishing. The idea is to optimum number of guides to line in the fishing rod. Not too many nor too little, given the length of the fishing rod.
Another model deciding optimal number of guides to the line of fishing rod depending on the results obtained from fishing would certainly help. Also, the parameters like the comfort attributes of the person who is fishing in using the fishing rod can be factored in.
– Mark has a fishing rod with overall length 300 cm. The table shown below gives the distances for each of the line guides from the tip of Mark’s fishing rod.
How well does your quadratic model fit this new data? What changes, if any, would need to be made for the model to fit this data? Discuss any limitations to your new model.
The cubic model designed to Leo’s fits Mark’s new data better than the quadratic one. What could be disturbing is that the length of the Mark’s rod is not same as Leo’s rod. This could imply that the cubic model fitted for smaller rod fits for lengthier rod. So, is the degree polynomial fitted relates to length of the rod? This will have to be found out with large number of dataset and proven empirically.
But, a new model based on that data is at best when the model is again quadratic. This again ignores the length of the fishing rod. What would be interesting is whether a model can devised to fit guides to line depending on the length of fishing rod. (Probably an exponential one?).