Flight Center Limited’s Accounting and Financial Management Report

Exclusively available on Available only on IvyPanda® Made by Human No AI

Trend analysis

In trend analysis, the changes in financial results of a company are analysed for different periods. When estimating the changes for more than one period, the earliest period is often used as the base year. In this case, the changes will be expressed as percentages for ease of analysis. The trend analysis will be carried out for the income statement and balance sheet of Flight Center Limited. The results will be compared with those of Thomas Cook Group. The analysis will cover a period of four years, that is, from 2011 to 2014. The calculations for the trend analysis are presented in the appendix.

Interpretation

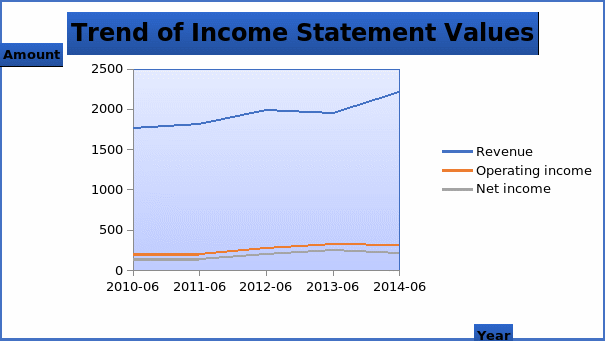
The revenue for the Flight Center grew during the four year period. However, in 2013, the company reported a decline. During the past two years, the airline industry has been in the international news headline for the wrong reasons ranging from crashes to the disappearance of aircrafts (Hoey, 2014). This has created a lot of volatility and loss of consumer confidence across the industry. Further, the changes in economic conditions also resulted in alterations in consumer spending behaviour. The volatility in the industry created a drop in revenue in 2013. However, when compared to its competitor, Thomas Cook Group, it can be observed that Flight Center performed much better than its competitor. The competitor had a significant drop in revenue as a result of changes in the business environment. Flight Center Limited reported growth in operating income during the period except in 2014. The growth in operating income between 2011 and 2013 can be attributed to an increase in sales and a significant reduction in sales, general and administrative (SGA) especially in 2013. In 2014, it can be noted that other operating expenses and SGA grew at a rate that is higher than the growth of revenue. This resulted in a slight decline in operating income. In the analysis, it can be noted that the company did not have cost of revenue in some years. On the other hand, the operating revenue for Thomas Cook Group dropped in 2013 and 2014. There were no significant changes in interest expense for the Flight Center Limited. It shows that debt remained fairly stable during that period. When compared to its competitor, it can be observed that the interest expense for Thomas Cook Group rose during the period. This shows that the amount of debt in the capital structure increased. Further, the income generated from non-operating activities also improved during the period. The company experienced growth between 2011 and 2013. However, in 2014, there was a 30% drop in other income. There is a direct relationship between taxes and income before taxes as indicated in the data provided. Between 2011 and 2012, the net income remained constant. The value increased between 2012 and 2013. In 2014, there was a 15.85% drop in net income. On the other hand, Thomas Cook Group had negative profit during the period with a slight improvement in 2013 and 2014. Despite the volatility in the industry, Flight Center Limited performed better than Thomas Cook Group. The graph presented below shows a trend of various items from the income statement of Flight Center Limited. In the graph, it is evident that there is a general increase in the balances.
Interpretation

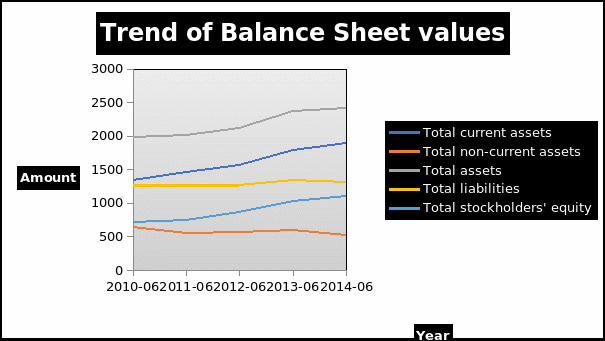
Even though there were fluctuations in the results reported in the income statement, a steady growth was exhibited in the balance sheet of Flight Center Limited. The total assets rose during the period. The speed of growth was high during the first three years. Further, it can be noted that the current assets accounted for more 65% of the total assets. This proportion increased during the period. A greater proportion of growth in total assets can be attributed to increase in current assets. On the other hand, the total assets for Thomas Cook Group fluctuated during the period. The current assets accounted for over 20% of the total assets. This proportion grew during the period to about 30% of total assets. The total liabilities for Flight Center fluctuated during the period. Further, the proportion of current liabilities was over 90% of the total liabilities. In the case of Thomas Cook Group, the current liabilities accounted for more than 60% of the total liabilities. Further, the amount of short term and long term debt dropped significantly. It can be observed that Thomas Cook Group has a higher balance of debt than the Flight Center Limited. This shows that the competitor is highly levered. Finally, there was growth in stockholder’s equity. This was caused by a significant growth of retained earnings. On the other hand, the balance of stockholder’s equity for Thomas Cook Group dropped significantly (Martin, 2015). This can be attributed to the increasing balance of negative retained earnings. Based on the analysis of the balance sheet, it can be concluded that Flight Center Limited has a better financial standing than Thomas Cook Group. The graph presented below shows trend of values drawn from the balance sheet of Flight Center Limited.
Trend of Balance Sheet values

Recommendation

The trend analysis above, did not give a detailed analysis of the strengths and weaknesses of the company. Therefore, a more comprehensive method such as ratios analysis should be used to evaluate the performance of the two companies. This analysis helps the management in evaluating unexpected changes in the balances reported. Further, it helps the management in establishing whether the objectives are met or not. The trend analysis shows that there is growth in most balances reported in both the statement of financial position and the income statement. However, since the airline industry has been volatile in the recent past, the company needs to diversify operations. This will improve the sales revenue. The company also needs to manage the sales, general and administrative expenses effectively. This has a potential of increasing operating profit. In the balance sheet, the proportion of current assets should be reduced by decreasing the balance of cash and receivables. The current assets cannot be used to generate revenue. Further, the company should invest in property, plant and equipment because there is a direct relationship between fixed assets and sales. Emphasis should be put on assets that can generate revenue. Finally, the proportion of total liabilities should be reduced.

References

Hoey, T. (2014). Why flight centre is a bargain. Web.

Martin, B. (2015). China deal adds new dimension to Thomas Cook. Web.

Appendix

Flight Center Limited

Income Statement

Trend analysis
2011-062012-062013-062014-06
Revenue3.06%9.14%-1.92%13.47%
Cost of revenue9.78%
Gross profit-7.37%9.06%9.21%13.47%
Operating expenses
Sales, General and administrative5.80%70.80%-48.44%11.57%
Other operating expenses-103.86%11787.50%-137.22%34.46%
Total operating expenses-8.60%5.37%7.48%16.56%
Operating income2.06%36.36%18.89%-1.87%
Interest Expense6.25%-11.76%6.67%3.13%
Other income (expense)32.43%4.08%17.65%-30.00%
Income before taxes7.04%36.15%20.34%-7.16%
Provision for income taxes23.73%23.29%14.44%13.59%
Net income from continuing operations0.00%42.86%23.00%-15.85%
Net income0.00%42.86%23.00%-15.85%
Net income available to common shareholders0.00%42.86%23.00%-15.85%
Earnings per share
Basic0.00%42.86%23.00%-16.26%
Diluted0.00%43.17%22.61%-15.57%
Weighted average shares outstanding
Basic0.00%0.00%0.00%1.00%
Diluted0.00%0.00%0.00%0.00%
EBITDA4.58%24.92%16.17%-4.64%

Flight Center Limited

Balance sheet

Trend analysis
2011201220132014
Assets
Current assets
Cash
Cash and cash equivalents7.97%5.85%18.90%2.85%
Short-term investments-32.99%-7.69%-16.67%-18.00%
Total cash4.00%5.00%16.94%2.04%
Receivables24.19%11.17%12.15%15.83%
Inventories0.00%0.00%0.00%0.00%
Prepaid expenses17.39%3.70%-21.43%4.55%
Other current assets-9.09%0.00%-50.00%-20.00%
Total current assets8.62%6.70%14.42%5.77%
Non-current assets
Property, plant and equipment
Gross property, plant and equipment3.60%9.38%11.43%9.12%
Accumulated Depreciation14.62%15.44%12.21%15.03%
Net property, plant and equipment-6.08%3.60%10.42%1.26%
Equity and other investments-60.00%16.67%-42.86%25.00%
Goodwill-15.64%3.27%5.63%-9.00%
Intangible assets-10.26%-1.43%-2.90%-53.73%
Deferred income taxes-16.13%-3.85%2.00%-15.69%
Other long-term assets66.67%40.00%0.00%28.57%
Total non-current assets-13.43%2.37%4.81%-11.05%
Total assets1.62%5.47%11.93%1.56%
Liabilities and stockholders’ equity
Liabilities
Current liabilities
Short-term debt6.45%-54.55%-2.22%-2.27%
Accounts payable1.88%13.36%3.25%11.02%
Deferred income taxes3.64%0.00%-14.04%-73.47%
Other current liabilities1.16%2.68%16.75%-1.91%
Total current liabilities1.85%-0.35%11.52%-2.10%
Non-current liabilities
Long-term debt-18.82%-10.14%-95.16%-33.33%
Deferred taxes liabilities-45.45%-16.67%-20.00%-100.00%
Other long-term liabilities5.88%13.89%26.83%-5.77%
Total non-current liabilities-14.62%-2.70%-45.37%-13.56%
Total liabilities0.16%-0.55%6.57%-2.45%
Stockholders’ equity
Common stock0.53%0.52%1.31%0.77%
Retained earnings15.73%25.58%23.67%8.90%
Accumulated other comprehensive income74.42%-5.33%-49.30%-25.00%
Total stockholders’ equity4.22%15.65%19.72%7.02%
Total liabilities and stockholders’ equity1.62%5.47%11.93%1.56%

Thomas Cook Group

Income Statement

Trend analysis
2011-092012-092013-092014-09
Revenue10.34%-3.24%-1.86%-7.79%
Cost of revenue12.95%-3.83%-1.65%-7.87%
Gross profit1.70%-1.10%-2.65%-7.52%
Operating expenses
Sales, General and administrative4.78%27.02%-26.80%-8.68%
Restructuring, merger and acquisition62.86%-100.00%#DIV/0!#DIV/0!
Other operating expenses27.10%0.79%-14.31%-9.76%
Total operating expenses24.55%1.53%-16.20%-9.62%
Operating income-254.44%-22.22%104.08%315.38%
Interest Expense10.64%25.00%38.46%-20.00%
Other income (expense)-2.94%9.09%-125.00%-366.67%
Income before taxes-1047.62%21.86%-67.42%-27.85%
Provision for income taxes207.69%-12.50%-52.38%-98.00%
Net income from continuing operations-17366.67%13.90%-64.75%-44.71%
Net income from discontinuing ops
Other-40.00%-233.33%100.00%-137.50%
Net income17266.67%12.48%-66.04%-40.70%
Net income available to common shareholders17266.67%12.48%-66.04%-40.70%
Earnings per share
Basic#DIV/0!9.84%-74.63%-52.94%
Diluted#DIV/0!9.84%-74.63%-52.94%
Weighted average shares outstanding
Basic0.47%1.63%37.16%20.40%
Diluted0.47%1.63%37.16%22.41%
EBITDA-129.15%66.67%-259.35%6.48%

Thomas Cook Group

Balance sheet

Trend analysis
2011-092012-092013-092014-09
Assets
Current assets
Cash
Cash and cash equivalents5.59%28.13%233.04%-33.49%
Short-term investments37.65%-66.67%-35.90%172.00%
Total cash12.00%5.04%211.60%-30.23%
Receivables7.39%-16.14%-14.83%-6.67%
Inventories21.88%-23.08%-6.67%21.43%
Prepaid expenses20.13%-10.81%-100.00%#DIV/0!
Other current assets2.59%-8.08%-19.78%-54.79%
Total current assets12.43%-7.41%31.43%-8.69%
Non-current assets
Property, plant and equipment
Gross property, plant and equipment-2.28%-31.94%5.64%-9.23%
Accumulated Depreciation1.04%-45.88%16.73%-12.27%
Net property, plant and equipment-7.04%-10.25%-4.76%-5.74%
Goodwill#DIV/0!#DIV/0!-6.76%-18.65%
Intangible assets-7.29%-102.70%-223.96%239.50%
Deferred income taxes-26.63%-27.05%-18.05%16.07%
Other long-term assets27.78%-35.51%-11.24%-10.13%
Total non-current assets-7.23%-13.10%-2.30%-7.40%
Total assets-3.06%-11.70%6.40%-7.81%
Liabilities and stockholders’ equity
Liabilities
Current liabilities
Short-term debt62.30%-80.81%363.16%155.11%
Capital leases#DIV/0!#DIV/0!#DIV/0!-20.93%
Accounts payable11.51%8.63%6.22%-2.24%
Taxes payable0.00%79.57%-34.73%-34.86%
Other current liabilities9.57%-10.76%-1.61%-0.38%
Total current liabilities11.79%-6.45%4.66%5.10%
Non-current liabilities
Long-term debt0.88%-5.05%13.91%-35.82%
Capital leases#DIV/0!#DIV/0!-9.45%-19.23%
Deferred taxes liabilities37.50%-25.62%-41.11%-7.55%
Accrued liabilities#DIV/0!#DIV/0!-100.00%#DIV/0!
Deferred revenues#DIV/0!#DIV/0!-100.00%#DIV/0!
Pensions and other benefits#DIV/0!#DIV/0!24.38%10.92%
Minority interest50.00%41.67%-23.53%-2.56%
Other long-term liabilities-13.86%-45.98%-9.06%-9.25%
Total non-current liabilities-2.11%11.43%5.66%-20.18%
Total liabilities6.97%-0.78%5.02%-3.96%
Stockholders’ equity
Additional paid-in capital222.22%0.00%1396.55%0.23%
Retained earnings38.92%66.48%18.69%10.81%
Treasury stock#DIV/0!#DIV/0!130.77%26.67%
Accumulated other comprehensive income-14.23%-6.57%-1.48%-3.70%
Total stockholders’ equity-32.13%-61.28%19.65%-47.99%
Total liabilities and stockholders’ equity-2.87%-11.42%6.14%-7.78%
More related papers Related Essay Examples
Cite This paper
You're welcome to use this sample in your assignment. Be sure to cite it correctly

Reference

IvyPanda. (2022, April 13). Flight Center Limited's Accounting and Financial Management. https://ivypanda.com/essays/flight-center-limiteds-accounting-and-financial-management/

Work Cited

"Flight Center Limited's Accounting and Financial Management." IvyPanda, 13 Apr. 2022, ivypanda.com/essays/flight-center-limiteds-accounting-and-financial-management/.

References

IvyPanda. (2022) 'Flight Center Limited's Accounting and Financial Management'. 13 April.

References

IvyPanda. 2022. "Flight Center Limited's Accounting and Financial Management." April 13, 2022. https://ivypanda.com/essays/flight-center-limiteds-accounting-and-financial-management/.

1. IvyPanda. "Flight Center Limited's Accounting and Financial Management." April 13, 2022. https://ivypanda.com/essays/flight-center-limiteds-accounting-and-financial-management/.


Bibliography


IvyPanda. "Flight Center Limited's Accounting and Financial Management." April 13, 2022. https://ivypanda.com/essays/flight-center-limiteds-accounting-and-financial-management/.

If, for any reason, you believe that this content should not be published on our website, please request its removal.
Updated:
This academic paper example has been carefully picked, checked and refined by our editorial team.
No AI was involved: only quilified experts contributed.
You are free to use it for the following purposes:
  • To find inspiration for your paper and overcome writer’s block
  • As a source of information (ensure proper referencing)
  • As a template for you assignment
1 / 1