A forecast can be described as prediction of future events. The forecasting process commonly involves manipulation of historical data using various mathematical models. The process is commonly used by operations managers to approximate how the business will perform in the future. Many firms depend on forecasting techniques to scale their production, financial, marketing, and staff planning processes.
Various techniques can be used for qualitative and quantitative forecasting. Qualitative techniques exploitperceptions, decisions, experience and many other factors that are usually hard to measure.
On the other hand, quantitative forecasting commonly utilizes company records along with causal, associative and relations data to project future trends in demand. There are various techniques used in quantitative forecasting which may include thesimple approach, exponential smoothing, among other projection techniques. Linear regression is used to establish the associative model of forecasting. Qualitative forecasting is rarely used to identify future projections in a business setting.
Most quantitative forecasting approaches employ the use of mathematical formulas.Historically, forecasting was carried out using manual techniques. With the rapid advancement in computer technology, forecasting is now accomplished using software packages such as Forecast PRO, SAP, AFS, SAS, SPSS and Excel.
Analyzing the case study
The case study was conducted on the Southwestern University. The university is one of the most premier institutions in Texas and, currently, enrolls more than 20,000 students. The Southwestern University (SWU) is a major influence in the world of football and has always been in the top 20 college teams in the whole of the United States.
With the desire to reach the first position in the rankings, the college hired a legendary coach. With the arrival of the new coach, the attendance in the five Saturday home games steadily began to increase as shown in the tables below. The SWU stadium was constructed in 1953, and has a seating capacity of 54,000. With the rapid increase in the number of people attending the five annual matches, the coach started to push for expansion of the University stadium.
The president of SWU, requested for a forecast to be used as a guideline to show when the current capacity will be exceeded. The president asked his deputy to consider conducting a revenue projection for the coming years. The 2010 cost for attendance was assumed to be 50$, with a 5 percent increase per annum.
Table 1: 2004 stadiumattendances
Table 2: 2005 stadiumattendances
Table 3: 2006 stadiumattendances
Table 4: 2007 stadiumattendances
Table 5: 2008stadiumattendances
Table 6: 2009 stadium attendances
Discussion Questions
Develop a forecasting model, Justifying its selection over other techniques, and project attendance through 2011
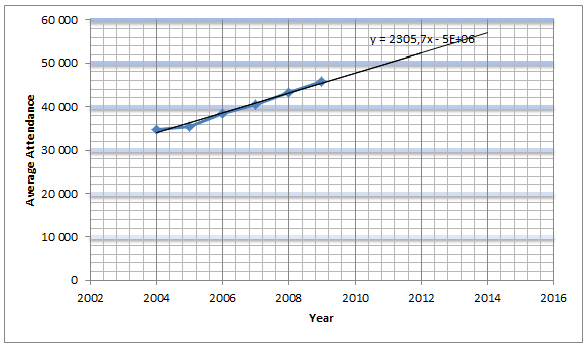
The trend projections method was used to project the 2011 attendance. The method was selected because of the nature of the historical data provided. The data show a steady growth in the annual average attendance. The steady increase in attendances, from 2004 through to 2009 can be used to create historical data points.
The data point can in turn be used to create a straight line that will provide a basis for projecting future forecasts. By pinpointing the y- intercept, one can effectively forecast the approximate attendance at any point in the near future.
Several other forecasting techniques can be used to accomplish the same, but the trend projections method is easy to use and gives a straightforward forecast. The method is also advantageous in the sense that it enables the user to identify the approximate values of random future points.
Table 7: Average attendance per year

Chart 1: Trend line projection showing the future average Saturday home game attendance
The trend projections chart above shows how match attendances will increase in the coming years. According to the projection line, the average attendance for the five Saturday home games in 2011 will be approximately 50,000. This has been determined by locating the y- intercept at the point where the mark for the year 2011 crosses the line. Therefore, the approximate attendance for the whole year will be 50,000 × 5 = 250,000.
What revenues are to be expected in 2010 and 2011?
It was assumed that the ticket price in 2010 will average to $50
Using this figure, the revenue estimates forthe year 2010 will be:
2010 revenue estimates = $ 50 × 48,000 × 5 five Saturday home games = $ 12,000,000
With a 5% increase in ticket prices for every year, the 2011 ticket price will be:
= (50÷ 100 × 5) + 50 = $52.5
The projected attendance for 2011 is 250,000. Therefore, the revenue estimates for 2011 will be:
2011 revenue estimates = 250,000 × 52.5 = $ 13,125,000
Discuss the school’s options
With the projections showing rapid increase in the number of attendances per game, the school needs to identify ways of catering for the additional fans. The current stadium has a seating capacity of 54,000. According to the forecast data, the average game attendance will be 48,000 in 2010 and 50,000 in 2011.
At this rate, it means that the attendance will surpass the stadium seating capacityby the year 2014. This implies that there is a dire need for extra seats, and this can be achieved in two ways. First, the school can increase the capacity of the current stadium so that it caters for the additional attendances. However, this will only provide a short term reprieve since it will not be long before the stadium’s threshold is reached.
Secondly, the school can consider the option of constructing a new stadium. Though it is the best option for long term needs, it may turn out to be time consuming and expensive for the school to implement. Additionally, it runs the risk of interfering with the games calendar as the school may be required to demolish the existing stadium. This option can be considered if the school has extra land on which a new stadium can be erected, and has sufficient resources to ensure a speedy construction.