Introduction
- In the business world, firms activities are normally based on risks and uncertainties present in the market.
- Therefore, to reduce the risk that comes with these uncertainties, organizations use various forecasting models to determine the status of their future operations.
- Forecasts are applied to various aspects of the business, for example in production, sales, market share, budgeting ,and research and development.
- There are different types of forecasting methods that can be used for different areas of the business.
- The type of forecasting method to be used depends on the type of business organization and the stage of the product life cycle.
- The forecasting techniques range from simple to highly complex methods.
Forecasting forms the basis for planning and budgeting in any business organization. It is also necessary for capital expenditure analysis and analysis of mergers and acquisitions.
When choosing forecasting methods, one has to consider factors like preparation time, costs involved, accuracy required and the duration of the forecast.
Types of Forecasting Methods
- There are two broad categories of forecasting methods; qualitative and quantitative. (Taylor, 2010)
- Qualitative methods are judgmental in their approach.
- They are subjective- represent the opinions of experts or the general public.
- Applicable in situations where there is no past data.
- Appropriate for short and intermediate term forecasts.
- Can be used to supplement the projections made using any of the quantitative methods.
- Quantitative methods use mathematics and are based on past data.
- They are objective in their approach.
- Are consistent as long as there is quantifiable data.
- Their consistency also relies on the external environmental remaining unchanged (Taylor, 2010).
Qualitative forecasting methods are, in essence, educated guesses. Relies on the professional opinions of experts, or the general opinions of the consumers to predict future markets.
Quantitative methods use a time series model in which a forecast is generated from a time series data, or a causal model that explores the cause-and-effect relationship.
Qualitative methods (Examples)
- Executive Opinions;
- Delphi Method;
- Sales-Force Polling;
- Market Research/Consumer Surveys.
These are the most common qualitative methods that are used by many business organizations.
Executive Opinions
- Involves a group of industry experts coming together to discuss and come up with forecasts.
- The experts are drawn from various departments like production, sales, finance and administration (Madura, 2010).
- This method is quick and easy, no elaborate data to apply.
- Valuable when there is inadequate data.
- The downside is the possibility of “group think”.
When a group meets, there are inherent problems that it is faced with. High cohesiveness stifles any dissent, strong leadership pushes of unanimity of opinions, and insulation of the group shields them from external opinion. All these can lead to “group think”.
Delphi Method
- Industry experts are questioned individually rather than meeting in a group.
- This eliminates the chances of dominant personality factors fueling consensus (Granger & Timmermann, 2006).
- This method is very effective when long-range forecasts are needed.
- The advantage is that it might be very hard to find consensus.
The results from the individual interviews are analyzed and grouped. The questions are reformulated and posted back to the experts. This is repeated in a bid to find consensus amongst the experts.
Sales-force Polling
- Relies on the insight of salespeople who are in continual contact with the customers.
- Their closeness to customers is believed to give them a good opportunity to be able predict future markets.
- There is the risk of the sales people being overly optimistic or pessimistic in their predictions.
- The sales people may not be aware of larger economic events beyond their control.
Sales people are in direct contact with the consumers on the ground. They listen to their opinions and concerns, and are therefore well placed to gather data from them.
Market Research/Consumer Surveys
- Businesses conduct surveys amongst their customer base to get their opinions on various products or services.
- Data is collected through personal interviews, questionnaires, emails or phone calls.
- The results of the surveys are analyzed and presented using various statistical methods.
- Valuable for getting direct feedback from the customers themselves.
This method is very good for collecting data about specific products. Usually gives good insight into how consumers regard the products.
Quantitative Methods (Examples)
Time series methods
- Naïve methods;
- Moving average;
- Trend analysis;
- Exponential smoothing;
- Decomposition of time series.
Associative (causal) forecasts
- Simple regression;
- Multiple regression;
- Econometric modeling.
These are some of the most commonly applied quantitative methods of forecasting.
Naïve Methods
- Based on the assumption that the forecasts for a given period are equal to the actual values for the previous period.
- Used as the basis for comparisons with more sophisticated methods.
- The most cost-effective of the forecasting methods (Madura, 2010).
- Highly efficient and objective.
- Appropriate for level patterns.
Naïve methods usually need to be used alongside other more complex methods to generate better forecasts.
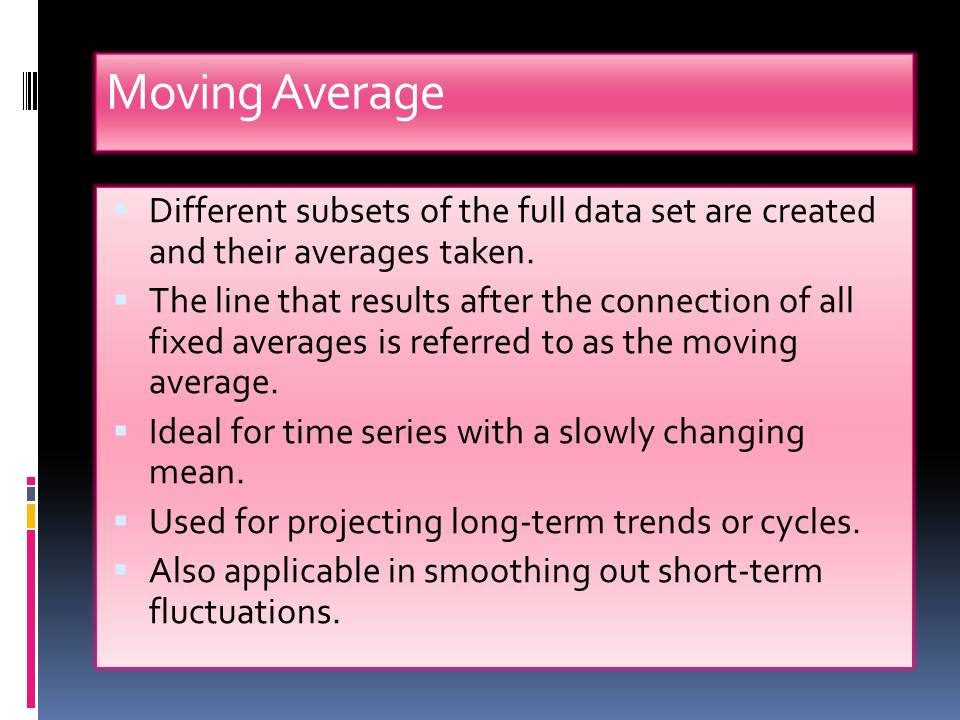
Moving Average
- Different subsets of the full data set are created and their averages taken.
- The line that results after the connection of all fixed averages is referred to as the moving average.
- Ideal for time series with a slowly changing mean.
- Used for projecting long-term trends or cycles.
- Also applicable in smoothing out short-term fluctuations.
The average of the first subset is taken, then for the second subset, the first value of the first subset is dropped, and the next value after the first subset is included and the average taken. The trend is repeated for all the values in the series.
Trend Analysis
- Used to describe the characteristics and behavior of observed data (Granger & Timmermann, 2006).
- Requires data that is in the form of a time series.
- Demonstrates whether a set of data show an increasing or decreasing pattern over time.
Can be used to make forecasts over a long period of time as long as there is adequate past data.
Exponential Smoothing
- The whole past is considered but more emphasis is put on recent data than on the less recent data.
- Involve simple calculations. Only the estimates for the previous period and current data are needed to calculate the new estimates (Roper & Wiley, 2011).
- Ideal for a time series that has a slowly changing mean.
If there is no forecast for the last period, the naïve method is applied. Alternatively, an average of the last few periods is taken.
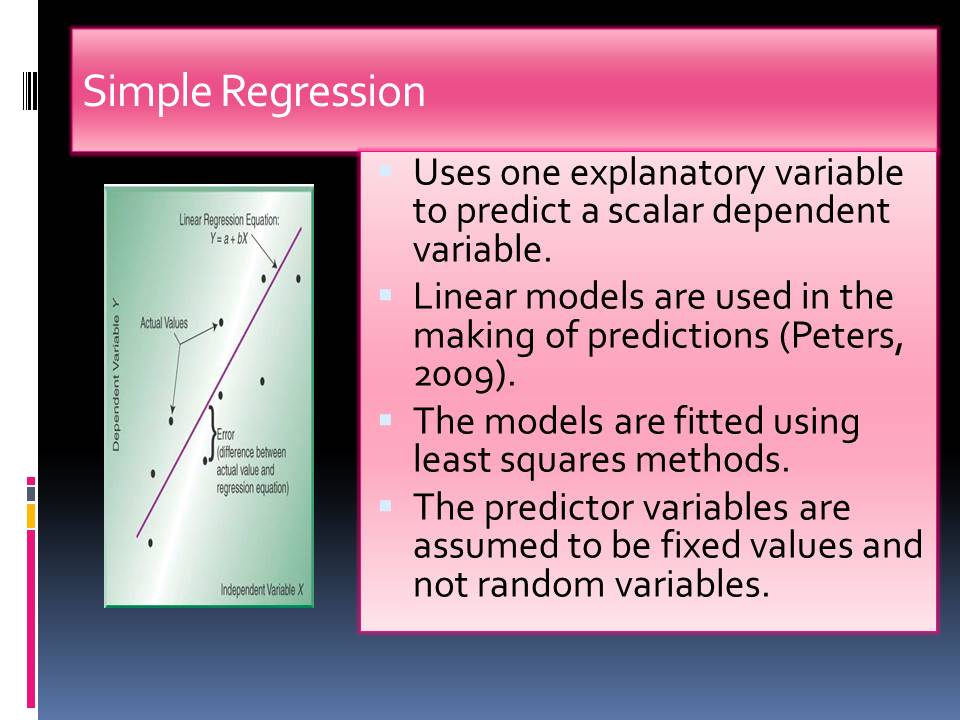
Simple Regression
- Uses one explanatory variable to predict a scalar dependent variable.
- Linear models are used in the making of predictions (Peters, 2009).
- The models are fitted using least squares methods.
- The predictor variables are assumed to be fixed values and not random variables.
Correlation coefficient (r) measures the direction and strength of the linear relationship between two variables. The closer the r value is to 1.0 the better the regression line fits the data points.
Multiple Regression
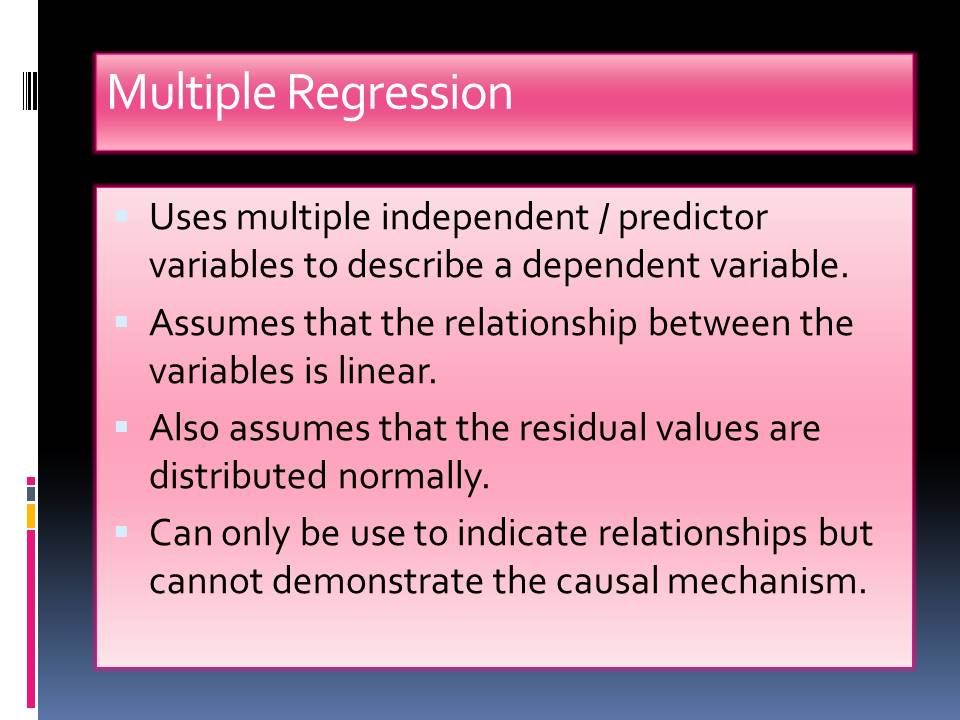
- Uses multiple independent / predictor variables to describe a dependent variable.
- Assumes that the relationship between the variables is linear.
- Also assumes that the residual values are distributed normally.
- Can only be use to indicate relationships but cannot demonstrate the causal mechanism.
It is just an extension of linear regression but there are multiple independent variables involved.
Econometric Modeling
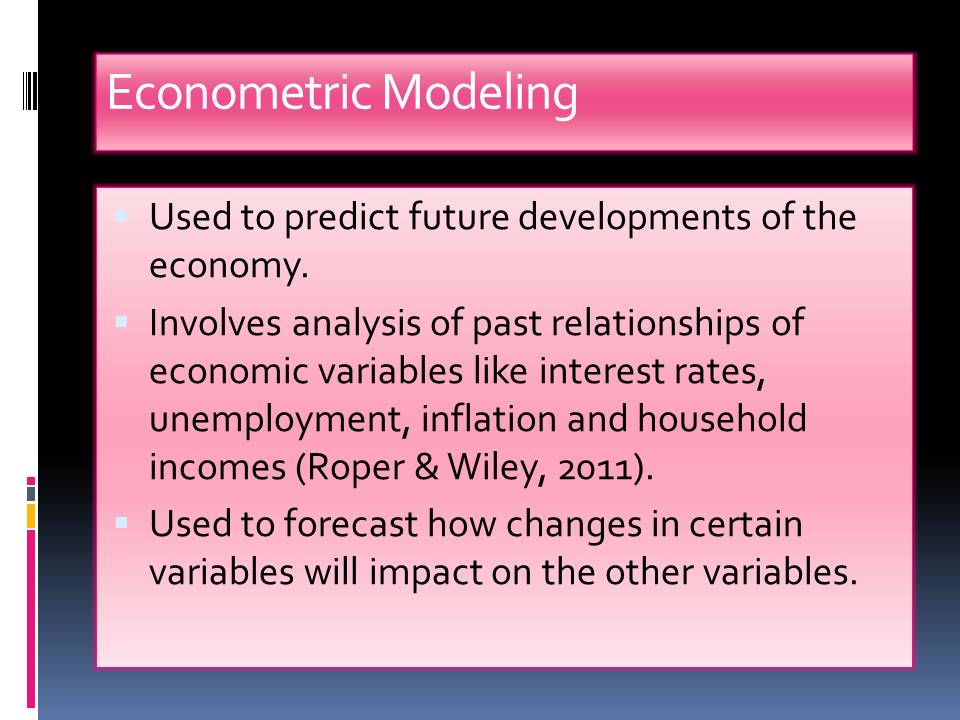
- Used to predict future developments of the economy.
- Involves analysis of past relationships of economic variables like interest rates, unemployment, inflation and household incomes (Roper & Wiley, 2011).
- Used to forecast how changes in certain variables will impact on the other variables.
These models are essential for economic planning. The model can predict growth or a recession so the authorities know what measures to take.
Choosing the right forecasting method
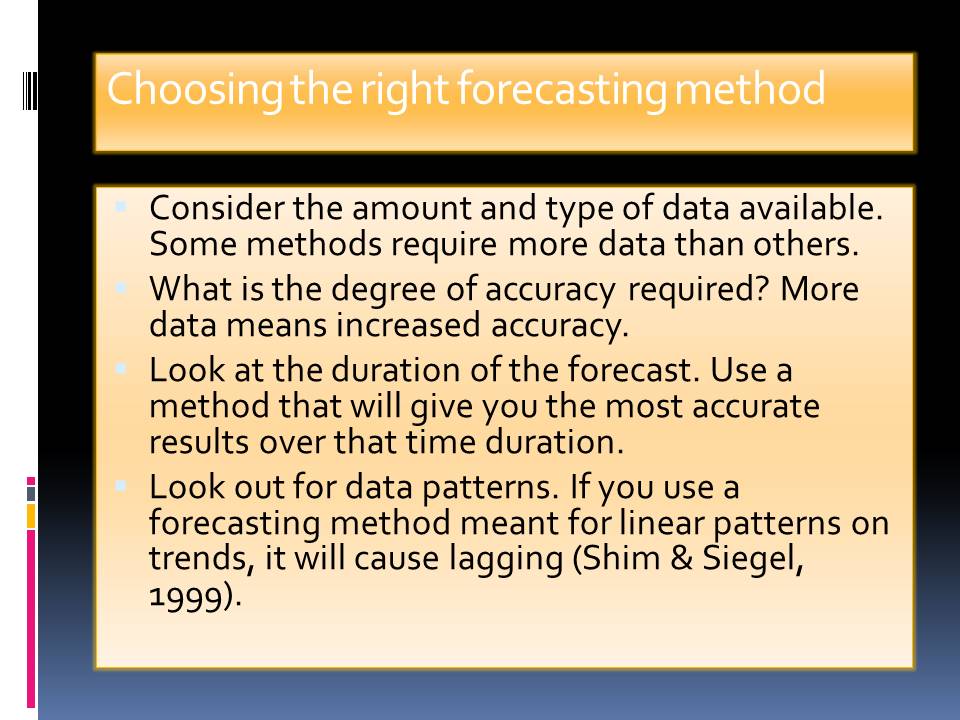
- Consider the amount and type of data available. Some methods require more data than others.
- What is the degree of accuracy required? More data means increased accuracy.
- Look at the duration of the forecast. Use a method that will give you the most accurate results over that time duration.
- Look out for data patterns. If you use a forecasting method meant for linear patterns on trends, it will cause lagging (Shim & Siegel, 1999).
Many business organizations employ more than one forecast method to any set of given data to enhance the chances of getting more accurate predictions.
Measuring the accuracy of forecasting methods
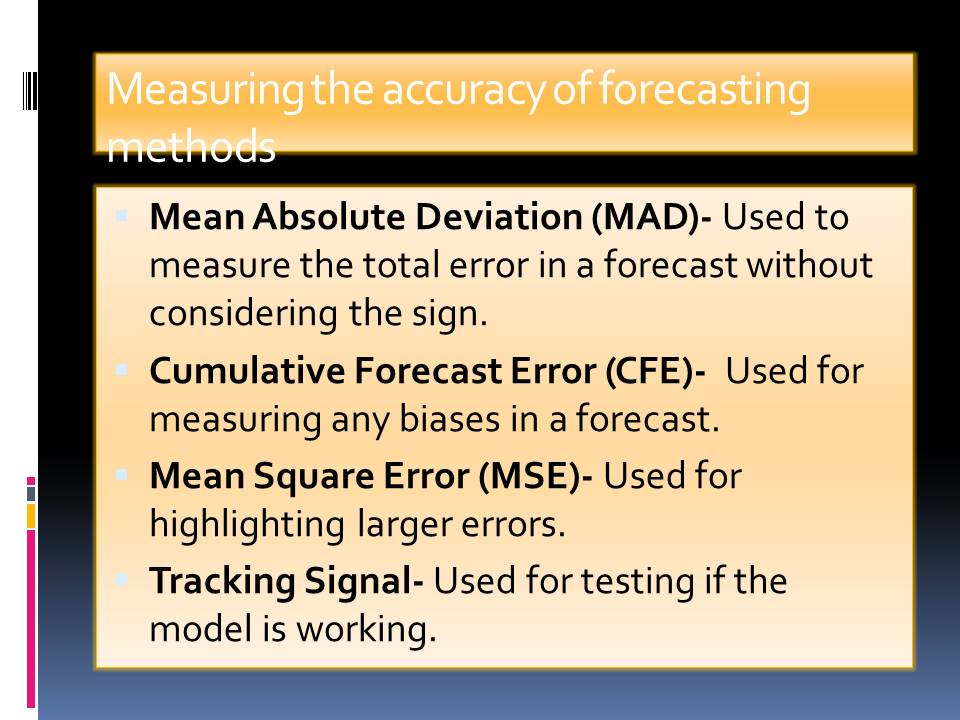
- Mean Absolute Deviation (MAD)- Used to measure the total error in a forecast without considering the sign.
- Cumulative Forecast Error (CFE)- Used for measuring any biases in a forecast.
- Mean Square Error (MSE)- Used for highlighting larger errors.
- Tracking Signal- Used for testing if the model is working.
The most accurate results are seen with situations where there is adequate data and the duration of the prediction is short.
Conclusion
- All the functional departments of a business organization require forecasting for better management (Shim & Siegel, 1999).
- Generally, forecasting methods can be grouped into:
- Qualitative methods;
- Quantitative methods.
- The qualitative methods are based on subjective opinions while the quantitative methods are based on mathematical models.
- The various forecasting models are suited for different situations. You have to choose the right forecasting method for any given situation for accuracy.
References
Elliott, G., Granger, C. W. J., & Timmermann, A. (2006). Handbook of economic forecasting. Amsterdam: Elsevier North-Holland.
Madura, J. (2010). International Financial Management. Australia: South-Western Cengage Learning.
Peters, M. (2009). Business Analysis. New York: Sage
Roper, A. T., & Wiley InterScience (Online service). (2011). Forecasting and Management of Technology. Hoboken, N.J: John Wiley & Sons.
Shim, J. K., & Siegel, J. G. (1999). Operations Management. Hauppauge, NY: Barron’s Educational Series.
Taylor, B. M. (2010). Introduction to Management Science. Upper Saddle River, NJ: Pearson/Prentice Hall.