Gifted students are those students who display a high level of creativity, intellectual ability, cognitive ability, as well as a high capacity for motivation. This group of students has a strong inner desire to learn more and does not require intensive attention in training compared to other students. Gifted students are also associated with good performance in class.
However, this is not just enough for a gifted student. In most cases, the number of gifted students varies from one place to another. The gifted students are found everywhere in all geographical regions, racial, ethnic and socioeconomic groups (Barbara, 2002).
At Broward, there is a unique pattern of the gifted students grouped in terms of race or ethnicity aspects. Statistics published by the Florida Department of Education indicated that out of the total 258, 827 students in the region, only 10, 721 out of these were gifted students (Florida Department of Education, 2009).
This implies that only 4.14 percent of the total number of students at Broward is gifted. This represents a very small fraction of the total number of students in the region. In other words, the number of gifted students is low compared with other category of students.
In Broward, the fraction of gifted students varies across different ethnic or racial groups. Some of the ethnic groups represent a smaller number of gifted students compared with other races. These racial variations in the number of gifted students can be attributed to various factors.
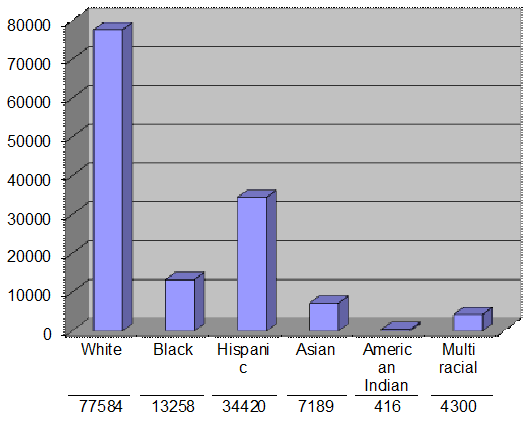
In Broward District, the number the black students was the highest from the total number of students who summed up to 98, 816 (Florida Department of Education, 2009). On the other hand, American Indian Alaskan native represented the smallest fraction of the total number of students in the region with the total number of 794 students.
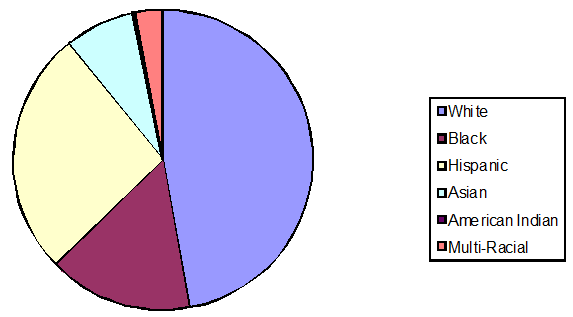
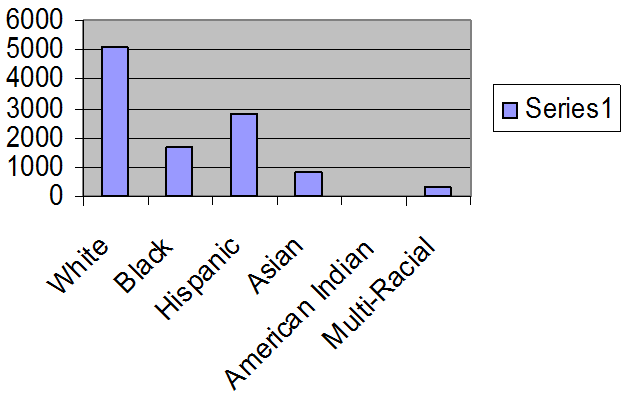
However, this distribution pattern does not reflect the number of gifted students in the region. For instance, the highest number of the gifted students were white whose number was 5, 060 out of the total 10,721 gifted students in Broward (Florida Department of Education, 2009).
This was followed by Hispanic students who summed to 2,844 in total. This is a variation of 2,216 students. This clearly indicates that the majority of the gifted students were white. The white students represented 47.20 per cent of the total gifted students. This percentage implies that almost half of the total gifted students in the region were white.
The ethnic category which represented the lowest number of gifted student’s was American Indian Alaskan Native which where only 32 students were gifted. These statistics also indicates that Broward district was dominated by black students unlike in other districts which were dominated by white students (Florida Department of Education, 2009).
When compared to other 67 districts in the region, both statistics revealed similar pattern. For instance, the highest number of gifted students was white in both cases. On the other hand, the lowest proportion of the total number of gifted students was from American Indian.
This indicates that there is no variation in terms of racial distribution across different districts. They all displayed similar results. However, the total number of gifted students in Broward was 4.68 per cent compared with the 5.13 percent for the total number of 67 districts in the region (Florida Department of Education, 2009).
This is clearly indicates that the total number of gifted students at Broward district was below average compared with other district in the region.


Sources of variations
These statistics reflects a high level of variations in gifted students in terms of racial and ethnic backgrounds. Similarly, the level of enrolled students differs across the races. These differences can be attributed to various factors which are possible causes for these patterns.
One of the possible causes of these variations could be population distribution. For instance, the number the population of American Indian in Broward is relatively lower compared to other races. The total number of students from group enrolled in schools will also be low. Consequently, the total number of gifted American Indian in the region will also be low.
There are various regulations which govern the way gifted students are handled. For instance, there are various plans which have been developed for the exceptional students. The variations in the implementation of these processes could be the major causes of the variations observed in the region.
Some of these programs or processes are vital in identification of exceptionally gifted students. For instance, poor implementation of these programs may lead to lower identification of the gifted students. For instance, through the Education plans, parents are supposed to be involved in identification and reviewing educational plans for gifted students (Department of Education, 2006).
However, this identification may differ from one individual to another. For instance, a parent may have two children who are both exceptional. However, their levels may differ. This parent may be tempted to believe that the other is not gifted through comparison. However, the two may all be gifted. In other words, the difference may be brought through identification criteria.
According to these results, the black students represented the highest number of students out of the total. This can be explained in terms of population. The blacks have a higher population compared to the other ethnic groups. In majority of black families, there is a higher likelihood to find more number of children than in a white family. This is one of the possible causes which could have attributed to a higher number of black students in the region.
Reference List
Barbara, C. (2002). Growing up Gifted. U.S.A: Merrill Prentice Hall.
Department of Education. (2006). Development of Educational Plans for Exceptional Students Who Are Gifted. Web.
Florida Department of Education. (2009). Gifted Membership Compared to PK-12 by Racial/Ethnic Category Free and Reduced Lunch and LEP Students.