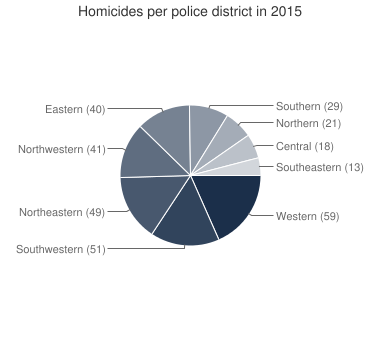
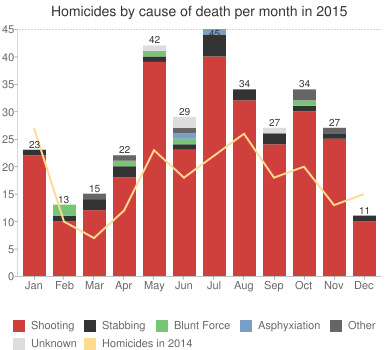
High crime rates have been a common problem in the city of Baltimore. In this section of the paper, I will discuss the crime rates in two different neighborhoods of Baltimore. I will compare the homicides that have taken place in Baltimore city from January to October 2015. In the east district of Baltimore city, there has been very high in 2015. The eastern districts have shown 40 homicides and the southwestern neighborhood has posted 51 homicides (see Figures 1 and 2). A comparison of the demographics of the victims by age and race, it is observed that in Eastern Baltimore average age of the victims is 28.5 years and there are more blacks than whites that are victims (Current Crime Trends, 2015). The GIS mapping shows that there are more homicides in the southwestern region of Baltimore City than in the eastern region. The data on homicides from January to October 2015 shows that the southwestern region is a more violent region than the eastern region, as in the former the occurrence of homicides is much higher (Baltimore City Homicides, 2015).
The income that the families have in these regions is low. The low income of the families in the southwestern region and a higher crime rate is representative of the social structure theory which is based on the axiom that social structure and standing have an indirect effect on the incidence in the locality. Therefore, our study of the Baltimore City neighborhood shows that the region with a lower average income has a higher rate of homicide as compared to the region, which has a marginally higher income. Further, as the southwestern region has been historically a high crime-prone region, the incidence of crime has gradually increased. This follows the social strain theory, which postulates that individuals belonging to a particular society are forced to commit crimes due to the pressure from within the community. Therefore, the areas, which have historically recorded high crime rates, will continue to do so in the future, as the younger generations are initiated into crime.


The homogeneous neighborhoods with almost similar geographical status demonstrate that there is little or no difference between the parcel demographics conditions of the region. Further, the nature of the crime committed is similar in regions with similar economic backgrounds.
The crime rates in the Baltimore city region are expected to increase every year. This may be due to the rise in unemployment and other concerns in the region. Further, the crimes committed are violent crimes such as homicide, rape, and armed robbery. Other forms of crime are theft, larceny, etc. The analysis shows that the victims of these crimes are mostly blacks and they belong to a predominantly black neighborhood. Therefore, intuitively it can be deduced that the neighborhoods where the black population of the city lives is more prone to committing a crime. Violent crimes have been a serious concern for families in the city. The victims of the crimes are mostly blacks who were earlier involved in some form of crime.
The analysis shows that crimes committed differ based on the demographic and socio-economic profile of the neighborhood. Further, regions with a high black population are more prone to violent crimes and homicides.
Works Cited
Baltimore Homicides. (2015). Web.
Baltimore City Homicides. (2015). Web.
Current Crime Trends. (2015). Web.