Introduction
A number of studies have carried out on the economic impact of international sporting events. The Goldman Sachs recently carried out a study to evaluate the economic impact of the Olympics. The researchers attempted to develop the relationship between economics, markets and the games.
This relationship was aimed at coming up with a prediction of the medals table. In their research, they found out that the host nations gain a lot by hosting the games.
The results of the researchers established that the host nations gain in the areas of political stability, human capital, technology, and both micro and macro economic environment. The stock market of such countries also gains significantly (The Goldman Sachs, 2012).
This works attempts to carry out similar regression analysis in order to validate the results of the Goldman Sachs. A lot of emphasis will be put on developing a regression equation that will be used to predict the medals table.
The analysis carried out by the Goldman Sachs
As mentioned above, the Goldman Sachs came up with a model to predict the results of the Olympics. The researchers used the concept of panel regression to come up with an equation that can predict the Olympic results for the various nations that attended the games.
Panel data regression is carried out on data collected on the same individual over different time periods (Greene, 2003).
The explanatory variables used in the analysis were; the population of various countries, a host dummy, medal attainment, and GDP (measured by the growth environment scores).
In this paper, the same variables in exclusion of a host dummy will be used in the estimation of the regression line. Besides, a linear regression line will be generated from the sample of 50 countries. The table presented below shows the results of the regression carried out.
From the results of regression analysis presented above, the regression line will take the form Y = -24.9956 + 0.784612X1 + 6.529764X2 + 0.046876X3. The linear regression model above can be used to estimate the number of medals that a nation will earn during an Olympics game.
Further, all the 50 nations that were used in the Goldman Sachs research were used in this analysis. None of the nation was omitted.
Analysis of the results
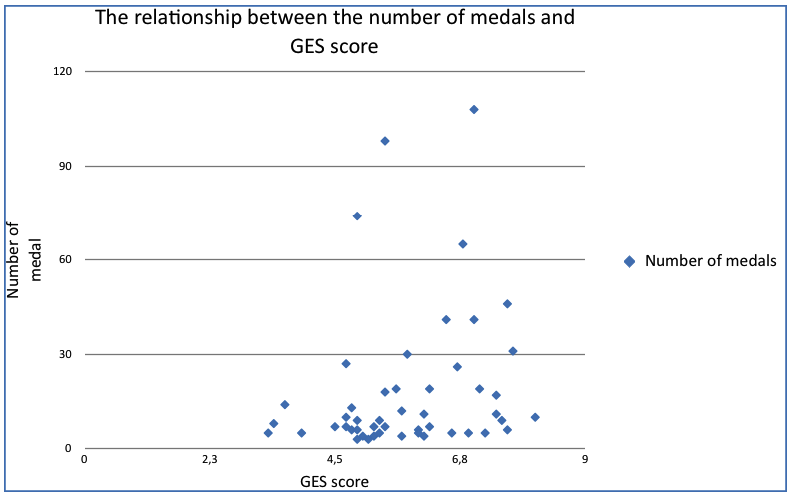
The results of the regression show that countries with high GES score will earn more medals than countries with low medals. This result is shown by the positive relationship between the GES score and the number of medals earned by the country.
The graph presented below shows the scatter diagram that displays the relationship between the number of gold attained by the various countries and the GES score.

Based on the scatter diagram above, there exists a strong positive relationship between the two variables. This gives an indication that nations that are economically endowed are likely to earn more medals than countries with less economic resources.
Secondly, the results show that countries that host the games earn a higher number of medals than the other countries. This was the case observed in China.
In summary, the results show that a large number of medals will go to countries that have a high GDP and a great potential for growth. Further, the model estimated in this paper is not consistent with the model predicted by the Goldman Sachs. They yield different results.
References
Greene, W. (2003). Econometric analysis. Harlow: Prentice–Hall.
The Goldman Sachs. (2012). The olympics and economics 2012. Web.