Introduction
It is important to understand the clear definition of an organization’s environment before putting up any optimization plan/action. The plan should incorporate the use of flow charts, which assist in defining specific functions for various action items. The use of some known tools such as Responsible, Accountable, Consulted, and Informed (RACI) helps in exploring some important action items to be implemented and their roles (Hinton, 2010). The e-commerce model is applied in this case for the purposes of equating products to form preferred action items. This enables the report to reveal full information about the products, including the values attached to them.
Google Analytics report provides the audience with a clear understanding of the range of techniques required for predicting business goals based on workable data. This can be used in achieving the company’s sustainable development. The report also analyzes in detail the importance of numbers and data used. Formulation of optimization action items with respect to the listed goals and in-depth analysis of presented data makes it easier for the challenges that might arise to be addressed explicitly.
Rationale
With the backdrop in the economy, there is a dire need for the implementation of business strategies that are efficient, effective, workable, and cost effective. As such, the report seeks to address these factors in a bid to improve performance in the business sector. It also addresses the case on how to improve the financial status of the company and those planning to join the industry. Hence the report aims at achieving sustainable business development by implementing achievable goals.
Business Goals Based on Data
- Attract more visitors and increase the user list.
- Maximizing sales and minimizing costs (Ecommerce overview, 2009).
- To use a list of keywords that are closely related and reflect the content on the page and images.
- To expand the business coverage to different regions.
- To introduce new technologies and manpower to meet the ever-changing business trends in order to achieve the companies’ set targets.
Optimization Plan and Actions
The dashboard assists in measuring performance; it is used as a tool for gauging the level of productiveness based on the way the site is used by the clients. It shows the total number of visitors that managed to access the site within the given time range, in this case, being 30,397 visitors. The high level of bounce rate, 46.82%, can be attributed to the length of time a page takes to download and also the use of commonly used Adwords terms, which makes the site vulnerable to users who might not be searching for your products or services (Dashboard, 2009).
There is a high percentage of the number of visitors viewing the web pages as compared to the number of exits, 70.43%, and 23.39%, respectively. The page views show the description of the number of pages viewed on the site during the specified time range. In order to increase the level of page views, there’s a necessity to cross-link the pages (Navigation summary, 2009).
The percentages created for the products include the item on sale required by the visitor and the duration of time needed for completion of the purchase transaction. The data shows the level of interest the visitors have in the products and the duration of time they are willing to wait for delivery. On the Dashboard we can see higher percentage purchasing; however most of the visitors have no time restrictions on their orders (Dashboard, 2009).
The data on this report helps in displaying the monetary metrics and the traffic source. The average order value is shown together with the rate of transactions and the total revenue generated in paid and non-paid traffic. The overview should include rate of conversion, total transactions and total purchases within the time range (Ecommerce Overview, 2009). The e-commerce can be used to collect many different types of data; the only caution is that all the visitors on the sites must be checked based on the Analytics privacy policy (Cutroni, 2008).
This data report reveals the visual representation on the basis of the steps designed earlier on. It clearly reveals the specific points on the website stages that need adjustment. The goal funnel reveals the percentage of prospects that proceeded with the desired online sales, and the specific reasons leading to such a move (Goal funnel, 2009). The stakeholders must identify the products which are fast moving in the market and increase the production of the same to feed the market, for example chocolate, unflavoured, vanilla, strawberry and sorbet (Ecommerce Overview, 2009).
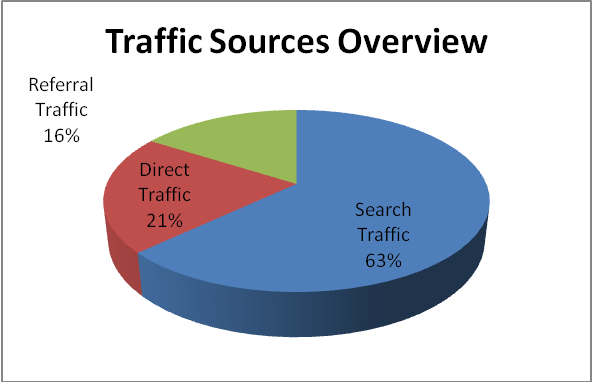
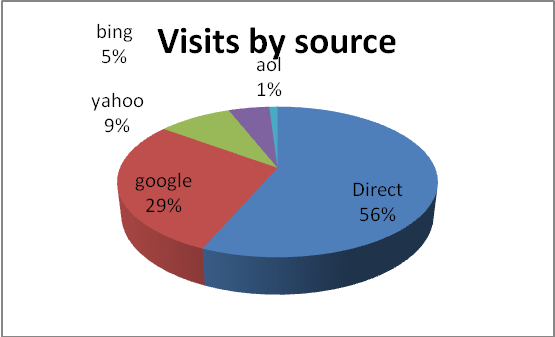
They should incorporate business strategies which are cost effective but accurate in carrying out the transactions i.e. Google (Transactions, 2009; Entrance sources, 2009). From the data collected on visits for all visitors between July 24, 2009 and August 23, 2009, it’s clear that most visitors were found through search traffic and so becoming the most convenient way of reaching out to many people (Visits, 2009). Incorporating site usage in business will ensure that all areas in focus are captured on a map and the trend analyzed in depth hence these gives a guideline on other areas that requires expansion (Dashboard, 2009). Introduction of new technologies like web analytics strategy can help build business process through managing and leveraging data (Aberdeen Group, 2007).
Importance of These Numbers and Data
Some of the importance of the data and numbers used in this report include;
- To analyze the checks and balances on then present trends in the business (Ecommerce Overview, 2009).
- To project the future prospect of the business (Navigation summary, 2009).
- To monitor and evaluate the business performance from time to time (Visits, 2009).
- To formulate new technologies and means of achieving the desired goals (Aberdeen Group, 2007).
Traffic sources Overview
This metric matters since it helps in the full understanding of the specific regions most of the users come from. For the organization to excel with the analytics, it requires to champion for a system where data is analysed corporately and is distributed freely. The analysed reports are required to correlate with the data since this encourages good understanding and acceptance. However for this to succeed all the processes involved must agree with the stated goals and objectives


Challenges to optimization
It is not possible as per the given data to scrutinize each transaction and have a full review of some details. It is not possible to retrace the visitor’s choice of products and the value they considered for a particular product (Ecommerce Overview, 2009). The other challenges include; Finances required for the implementation of optimization plan, Training of the required manpower, Technological change, Change management and Process change.
How to address the challenges
- Establish baseline values for the variables that have been identified as the drivers of change. Determine how to track changes in these metrics. Document and report on improvements.
- Optimizing desktop call handling can enhance agent efficiency and reduce training requirements.
- To ensure that the technology is effective for the users in a production environment, training must be done accordingly.
- There is need to institute formal change management program to help people adapt to the changes and ensure project success.
- Pilot the changes in stages by fine tuning the processes, technology application and plans based on the pilot results before rolling out to full production.
Conclusion
The benefits arising from these analytics can be traced back to Google AdSense account. The report gives detailed information on the performance of the site, the number of visits by new and returning visitors, the origin of those visiting your site and the search engine that is majorly used by your visitors. The report further gives breakdown of the most used sites and the keywords used as search engines. The effectiveness of the web pages is also revealed by showing the specific pages that are popular to the visitors. The data and numbers used in the analytics offer good grounds for creation of marketing strategies. The main advantage provided by the analytics report is that it has the capability of tracking all visitors and displays all the advertisements.
References
Aberdeen Group. (2007). Sector Insight; Analytics University. Web.
Cutroni, J. (2008). Google analytics Ecommerce Tracking Part 4. Web.
Dashboard. (2009). Analytics Report. Web.
Ecommerce Overview. (2009). Google Analytics Report. Web.
Entrance Sources. (2009). Google Analytics Report. Web.
Goal funnel. (2009). Google Analytics Report. Web.
Hinton, B. (2010). Business process optimization in contact center. Web.
Navigation Summary. (2009). Google Analytics Report. Web.
Transactions. (2009). Google Analytics Report. Web.
Visits. (2009). Google Analytics. Web.