Graphic organizers refer to tools of communications that are used to express concepts, information and even knowledge by using symbols, which are visual to give out specific meanings (Dye, 2000). A graphic organizer gives clear meanings by showing how facts, ideas and terms are related to each other. Graphic organizers are mostly used by teachers since they enable students to figure out the relationship and patterns which are not discovered through the provision of visual picture as explained by Dye (2000).
The following paper attempts to account for ways of introducing and organizing instructional content through the use of graphic organizers. Through graphic organizers, the students will be able to assimilate key concepts as well as related details. It also provides a copy of the graphic organizer and the set objective used to explain how students will organize specific lesson information for the same and how the graphic designer used is well suited for to the lesson content.
In order to enable students identify, organize and assimilate key concepts and related details there is a need to use graphic organizers in introducing and organizing instructional content (Dye, 2000). Before using any graphic organizational there is needed to describe its purpose to enable one know when it is applicable. There are three ways in which graphic organizers can be used to enhance students’ understanding. Firstly, the teacher can decide to use graphic organizers before instructions in order to provide structure of how the new material will be presented while indicating how the ideas are related to each other (Dye, 2000). In order to enable students have a clear view of what the topic will be covering the teacher may decide to introduce a graphic organizer.
Graphic organizer is an important tool to use during instructions. This helps students in reorganizing, processing and even separating key important ideas (Dye, 2000). During learning the students take an active role to enable them organize ideas and information having the opportunity of learning from their mistake and correcting them as explained by (Dye, 2000). Since most students have different learning styles each will be able to develop maps that will help them understand the ideas better.
Dye (2000) asserts that graphic organizer can also be used after instruction has been given. Most of the students who use graphic organizers tend to do so on the basis of their personal construction through the use of whole information given by the teacher to identify key concepts and organize them. This enables the teacher to know whether the student is able to interpret what they were taught and state in a brief and correct way. They are also able to identify the relationship of what was taught with the prior knowledge (Dye, 2000).
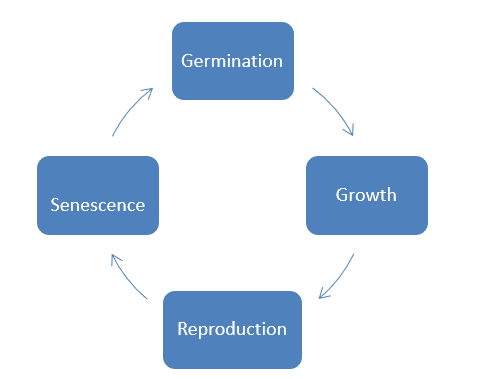
In this paper therefore, graphic organizer is introduced before instructions are given to enable students have a clear picture of what will be covered throughout the lesson. The objective used is, to describe the life cycle of plant including, seed germination, growth, reproduction and senescence. A graphic organizer used is “series of events chain” type. The instructions given to the students include, having a cycle which shows the various steps a plant undergoes during its growth. Explanation of what takes place at every stage and the importance of every stage of plant life as applied by (Dye, 2000). Below is a copy of “series of events chain” graphic organizer used.

The first triangle of the cycle shows the germination stage of development. During germination, certain conditions for growth are required and they include, water, oxygen gas and warmth. The seed absorbs water swelling and oxygen is used in the respiration process to provide food for the developing seed. The students will be able to figure out what happens in the first stage of plant development.
The second triangle will enable the students to have an idea of what takes place during the second stage of development (Dye, 2000). The second stage of development is growth, the seed has already germinated. Embryo forms which continue to grow forming roots in the lower part and shoot in the upper region. The roots continue to grow and spread deep inside the soil layers for maximum reach of water. The plant cell will continue to differentiate into different tissues which are complex forming roots, root hairs, leaves and even stem which contains vascular tissues such as phloem and xylem vessel (Dye, 2000)
The third triangle will show the students the third step of the life cycle which is reproduced as confirmed by (Dye, 2000). This stage includes pollination, fertilization and seed formation processes. Pollination occurs in plants which grow sexually where the gametes will be carried to the female parts of the plant by wind or insects. The process of fertilization then starts leading to seed formation. Lastly, the fourth triangle of the cycle shows the final stage of development of a plant’s life cycle. This enables students to have a draft idea of what happens in the last stage of plant development (Dye, 2000). In this case it is the senescence or old age in plants. This can be seen in leaf fall.
The graphic organizer used in this case is more appropriate to the lesson on plant life cycle. The triangles clearly show the various stages of plant development and the arrows show the smooth flow of steps from the first to the last. Dye (2000) asserts that the graphic organizer used will enable students to clearly visualize and interpret what take place in various stages of plants’ life cycle.
In conclusion, it is necessary to use a graphic organizer either by the teacher or student as it will help the students understand the idea or information more vividly. The use of graphic organizer improves students’ understanding rather than if ideas were expressed just in words alone without the use of some charts.
Reference
Dye, G. A. (2000). Graphic Organizers to the Rescue! Teaching Exceptional Children, 32 (3), 72-78.