Introduction
Currently, the most important source of water for human consumption and industrial use is groundwater. Hence, it is imperative to manage groundwater resources effectively and guarantee its future presence.
This requires proper identification and management of possible threats to groundwater resources.
Previous cases of groundwater and surface water pollution have been globally. Today, however, the major cause of concern among environmentalists and other concerned bodies is possible pollution that may emanate from toxic chemicals used in fracking.
In Western Australia, for instance, the Conservation Council of Western Australia released a map (see figure 1) to depict that fracking could possibly contaminate groundwater resources and affect the state’s drinking water reserves.
The map highlights more than 35 water resources, including groundwater aquifers and surface water resources used to provide water for human consumption, are at risk of gas fracking pollution. In addition, it could affect nearby water resources such as Margaret River to Geraldton and other coastal areas.
Rapid population growth has put much pressure on limited water resources.
Consequently, studies in feasibility of groundwater are vital to meet the global water demands because the surface water is increasingly becoming unreliable, unsafe and unsustainable as extreme weather patterns, pathogens and microorganism cause adverse effects (Bashir, Yusoff, & Rindam 2014).
Generally, groundwater has been regarded as the most viable option because of its quality. It is also considered fresh, and it therefore can support human life, irrigation and other industrial purposes.
The use of groundwater to support consumption has been fully exploited and therefore is below the expected levels.
The low rates of exploitation perhaps have resulted from a lack of knowledge about hydrogeological activities of water formation, movement and distribution patterns.
New technologies, however, have presented opportunities to exploit groundwater resources and evaluate potential contaminations. In this regard, the 3D (three-dimensional) Geographic Information System (GIS) techniques are vital in geologic mapping techniques applied in protection of underground water.
It assists in decision-making and the public accessing the environment of the state.
The purpose of this study is to determine groundwater contamination using 3D GIS techniques.
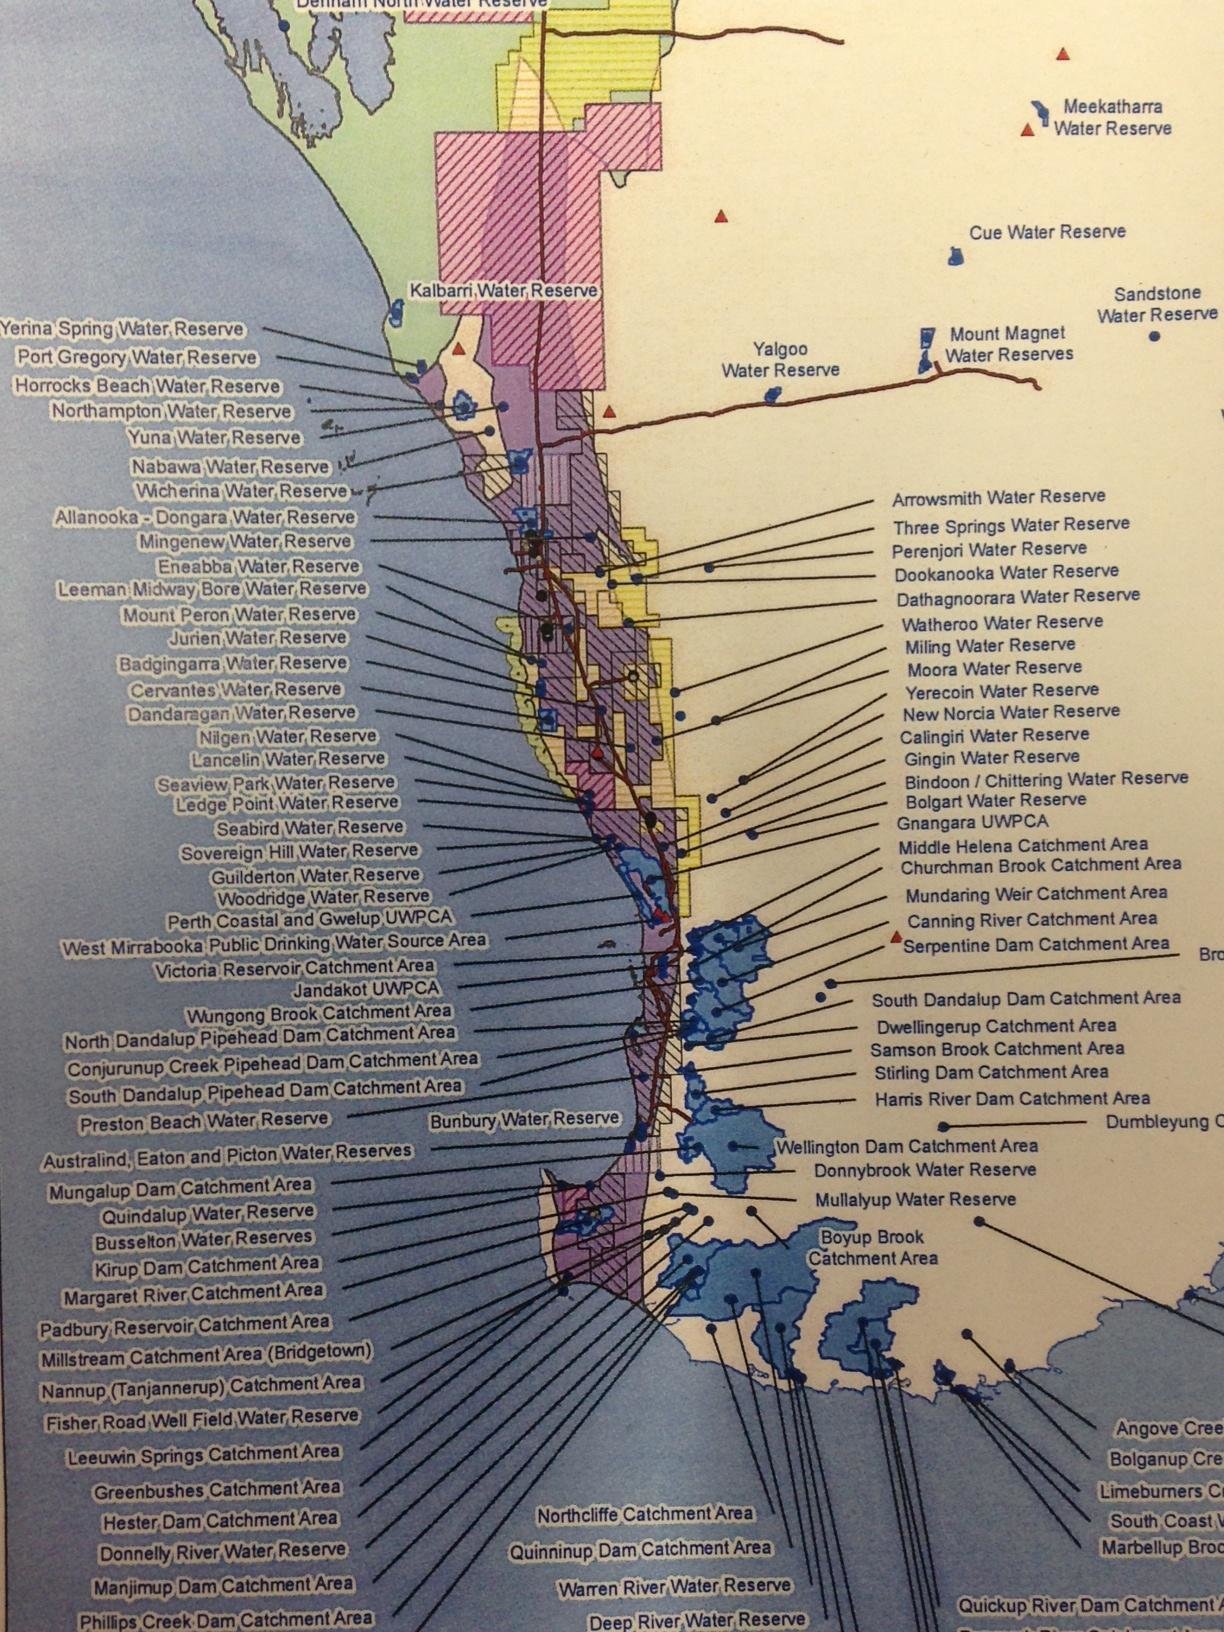
Figure 1: A map released by the Conservation Council of Western Australia showing possible quarter of the state’s drinking water reserves mostly likely to be affected by fracking (Riaz 2014)
Background
The 3D GIS techniques are fundamental in geologic mapping approaches applied in identifying and protecting groundwater resources from contamination. It assists decision-makers of a given critical geographical location to evaluate and understand the safety of underground water for public consumption.
Hence, comprehending the geologic framework, current land use and planning are now imperative for extraction of groundwater (Arias-Estévez et al. 2008, p. 247).
Currently, the procedures used to conduct the 3D geological studies are the same and consistent and the results too are similar. This method, for instance, has been applied in
Wyoming in the US due to many wells being drilled and related hydrologic concerns relating to coal-bed methane development.
For regulators who want to control the quality of groundwater, maps of groundwater sensitivity obtained from analysis of the 3D data of geologic materials usually offer the best information for decision-making.
Therefore, in the recent past, the use of the 3D GIS for such studies has grown significantly and it is imperative to evaluation and understanding of geographical features of the ground.
Moreover, various techniques such as grid modelling, tetrahedron network model or hybrids may be applied to represent different features of hydrological systems. The GIS can be used in any computer-enabled systems to assist in mapping and analysis of ongoing activities and process-related data from a given location.
According to Arias-Estévez et al. (2008), identification and mapping of the geologic strata, groundwater exposure, aquifer vulnerability and spread of contaminant are fundamental for choosing appropriate procedures for underground water monitoring, assessing, and controlling of toxic materials.
In addition, the obtained data can be used to develop intervention plans for cleaning and protection of contaminated areas. It is noteworthy that GIS has become common in both emerging and developed countries to study underground and hydrological features.
Hence, the use of GIS to investigate groundwater exposure and potential contamination is important to study because GIS is an important tool that can assist in developing mitigating strategies for many affected sites.
Specifically, using GIS to study groundwater contamination produced visualisation, optimization of available materials and the approach is relatively cost-effective. Through visualisation software, the researcher can display the site and manage data to understand contamination patterns from different substances.
As a result, it is imperative to comprehend the current applications, use, potential interventions, challenges and finally cleanup options (Arias-Estévez et al. 2008). Optimisation of samples requires adequate number of data sample required to categorise possible contaminated zones by using programme statistical packages.
The cost advantages of GIS is realised when the method efficient in applying the cleanup methods and achieving the intended goals. In addition, the GIS would determine the extent of human exposure and potential health risks because of groundwater contaminants.
The GIS is a complex process that integrates data from various sources for analysis in order to provide an environmental decision. Such data are used to support query procedures, visualisation, manipulation and optimisation.
In addition, the two-dimensional (2D) maps have been produced to depict a given area and related surface elements. The 3D Analyst extension (ArcGIS) usually offers the ability to depict two-dimensional maps as it strives to show a quasi-three dimensional illustration of the site feature.
Normally, the analyst can share and manipulate data using the available project files that are used for various different data integration and visualisation of files.
The GIS software has ability to combine large volumes of data to create the required visual elements to assist in understanding features of the study under investigation for contaminations.
The GIS strongest features allow it to integrate with other underground water model software such as MODFLOW and MT3DMS, which have been effectively used to detect groundwater contamination. Spatial data related to boreholes, wells and aquifers alongside their related features and the aquifer field features.
The analyst can display the base of aquifer, data infiltration, layer features and the injection of well data, the spread and dispersion of data on various features under investigation and any other hydrogeologic elements of interests.
The shape of the files based on the coverage can easily be extracted from the database and resulting data is a direct representation of the groundwater for modelling using software applications such as MODFLOW and the MT3DMS.
Currently, fracking activities rely on highly toxic materials, many of which remain undisclosed to the public, but it is known that gas, fracking chemicals, drilling fluids or fracking waste can contaminate drinking water, wells and groundwater resources (Riaz 2014).
As previously mentioned, these are highly toxic chemicals, which must not be exposed to groundwater and water for human consumption.
In Western Australia, for instance, people rely on groundwater for domestic, industrial, agricultural and other purposes, and they deserve clean water not contaminated with toxic chemicals from gas fracking.
The state government has already approved gas fracking at Drover-1 next several water boreholes, which supply water to Green Head and Leeman. However, no environmental impact evaluation has been performed.
As a result, many environmentalists and other concerned stakeholders have petitioned the government to suspend fracking activities, but no major alteration plan has been communicated to the public.
Opponents of gas fracking, however, have maintained that they do not have any confidence that the current regulation regarding environmental protection and gas fracking in Western Australia are effective and therefore the call for moratorium on gas fracking in the state (Riaz 2014).
The 3D GIS techniques can help to determine the extent of groundwater contamination in Western Australia as other studies have shown. The MODFLOW simulation techniques used in the GMS (Ground Modelling Systems) can be accomplished by using either grid approach or conceptual model strategies.
The grid model requires analysts to incorporate the 3D grid and incorporate the sources or well or other forms of model elements. This model requires researchers to use integrated GIS software applications based on the given map modules as they strive to develop the basic framework for the study site.
This approach assists researchers by eliminating the need for cell-by-cell editing (Wycisk et al. 2003).
Using the GIS offers several advantages to the analyst in attempts to detect groundwater contamination because of the integration with the sources of data containing queries and statistical analysis tools with geographic and visualisation capabilities.
In addition, the GIS provides the benefit of integrating other data from multiple sources, including Excel spreadsheet to enhance visualisation and manipulation. Likewise, the GIS can successfully produce 2-D maps of any given site and its related surface characteristics.
On this note, the 3-D analyst can exploit these robust features to generate a quasi-3D depiction of the region. Further, the GIS analyst can effectively share data and information from various sites with other team members.
On this note, the 3D data model would be appropriate for the study because of its robust features to integrate large volumes of geographical data and manipulate them to generate the required information.
Aims and Significance
- Determine groundwater contamination zones
- Create 3D Model of groundwater zones with source and distribution of pollutants
- Provide the 3D maps to the water resource management authorities, so that they can take preventive measures to stop water contamination in the ground
Gas fracking will be used to extract gas at Drover-1 next to several water sources in Western Australia. Consequently, there are possibilities of contamination from the highly toxic, escaping methane gas and other chemicals used in the process.
The developed map will be highly imperative for further studies in determining possible contamination paths and effective mitigation strategies. The GIS will focus on depicting different site hydrologic features and extraction of shale gas.
By borrowing from the study conducted in Montana, Wyoming, the coverage for the study will focus on critical areas such as water wells, boreholes, springs, hydrography, fracking gas monitoring wells, fracking gas wells, and pipelines for water supply.
It is expected the study outcomes will be used to address concerns of Communities, industries, agriculture and other businesses all the way up our West Coast in Western Australia. In addition, fracking gas stakeholders will use the recommendations to improve their process and prevent potential contamination of groundwater resources.
The research will result in usable visual resources such as maps and GIS database for spatial analysis and ease of understanding for fracking gas concerns.
Methodology
A study method applied by Khaled Kheder (2014) will be model for this study from a study. Based on the study site in Western Australia and its proximity to critical water supply sites such as wells and boreholes, it has been regarded as a large area. Data will be collected Drover-1, which is the study area.
Drover-1well is located 18 km southeast of Green Head, in the Shire of Coorow, Western Australia (AWE 2015). According to AWE, it successfully drilled wells in mid-2014 without any critical health, safety or environmental issues (AWE 2015).
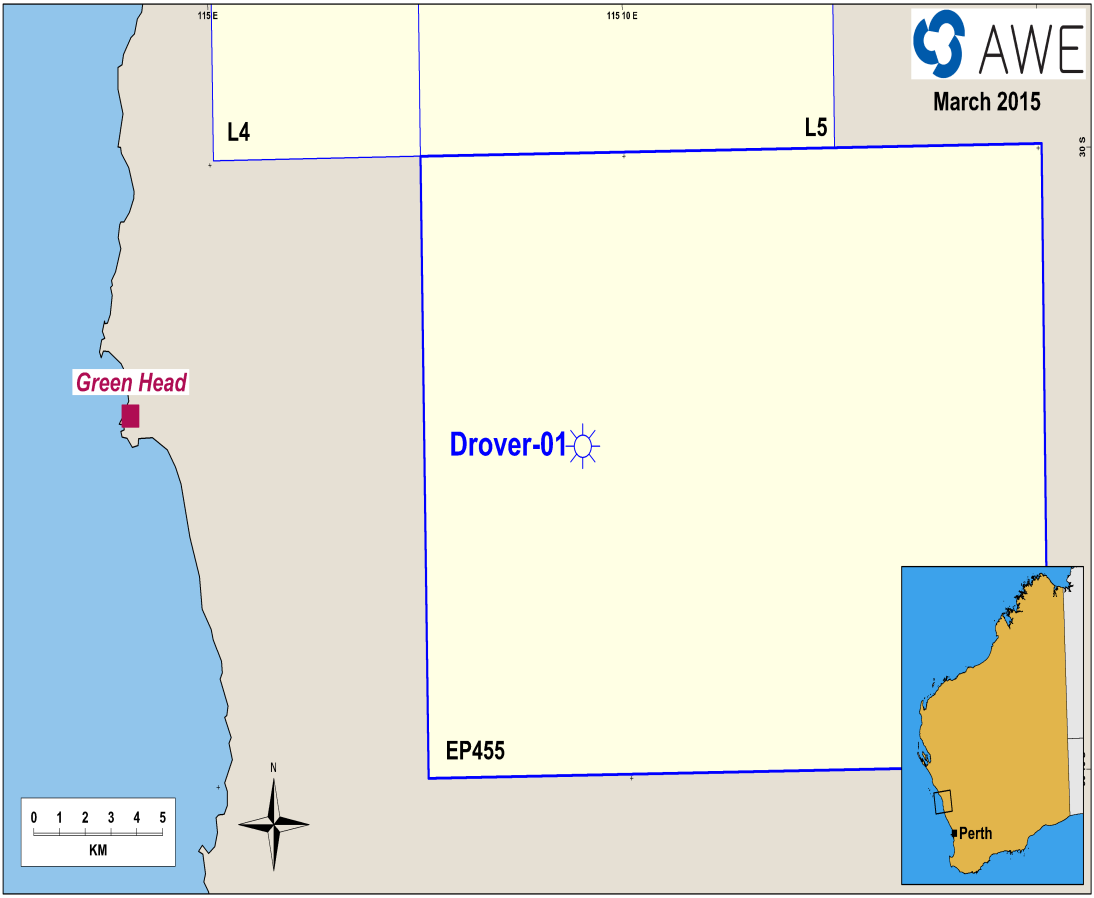
Figure 2: A map of Drover-1 well
AWE will provide critical data regarding the drilled wells. These data would be used for comparison purposes. Data for water levels, topography, maps for wells and boreholes for potability and shallow aquifer bedrock will be studied for the required insights on the flow models.
The Conservation Council of Western Australia and the WA Water Corporation have generated maps that would be useful for this study (see figure 1). In addition, they would also provide the necessary data in aid in analysis of potential pollution because of fracking gas activities.
Topography maps would be used to map the study site using appropriate scale. This would help in depicting bedrocks and other relevant features. The highest and lowest locations of Drover-1 and close water resource shall be identified. The ArcGIS Desktop application will be used to analyse the thickness of the grids of the study site.
Water tables will be identified and potability and hydraulic features will be evaluated to adjust the MODFLOW model.
Based on the map of the study area presented by the WA Water Corporation, there are over 35 water sites, which are most likely to be contaminated by toxic chemicals from gas fracking. Data for the water tables of the study area will be gathered from existing studies.
Appropriate models would be applied to determine the best calibration values for the wells based on observed values or simulated ones. Data would be analysed to achieve the expected results for aquifer features.
The second phase of data analysis would be highly complex because various data from different sources must be integrated using GIS. Data on hydrology, geology, soil type, land use, hydraulic conductivity, planning, cover and topography would be collected from relevant databases and used in the analysis.
To understand the groundwater vulnerability to contamination, data would be obtained from existing databases. A drastic model used Saidi, Bouri, and Dhia (2010) would be applied to determine groundwater vulnerability.
Depth to groundwater, recharge, aquifer type, soil properties, topographies, influences of vadose zone and hydraulic conductivity will be combined to determine groundwater vulnerability to toxic materials from gas fracking (Saidi et al. 2010). A significantly higher value would indicate increased vulnerability or greater chances of contamination.
It is recognised that large volumes of data are involved in this study. Hence, the researcher would carefully manage data from different sources and use them in appropriate models. The spatial databases would assist in this process. It would be imperative to use interpolation techniques in specific cases in which data would be insufficient.
This would control the issues of missing data during analysis.
MODFLOW model would be applied to determine groundwater flow.
Finally, the 3D models/map development would be provided to illustration groundwater vulnerability to contamination from activities of gas fracking.
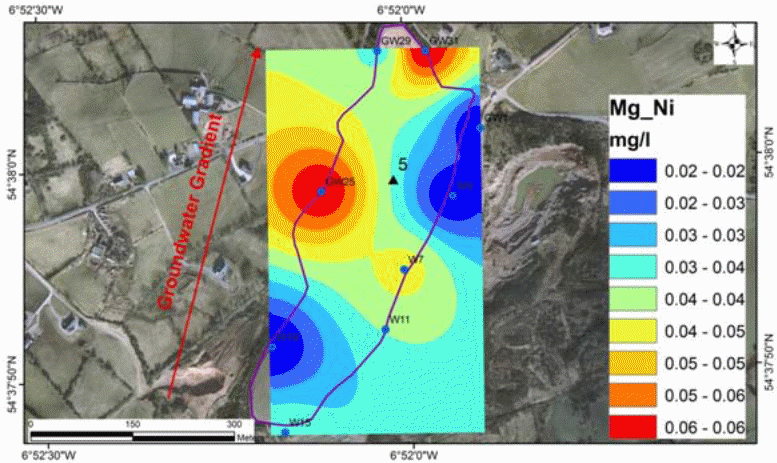
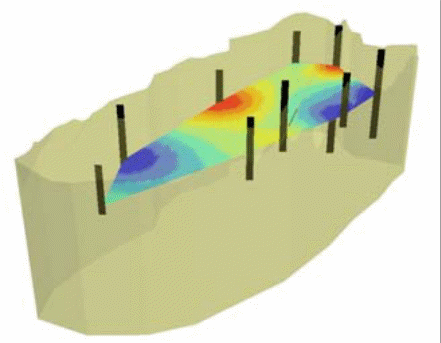
Figure 3: GIS 3-D model of concentration of Ni figure: source
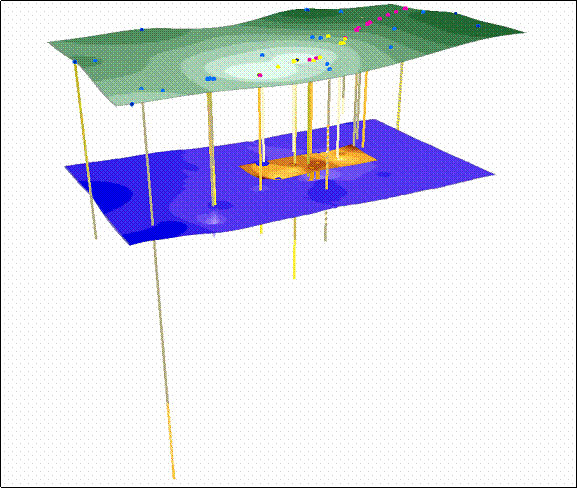
Figure 4: 3D cube of the site showing porosity and permeability (can be used to predict migration with time)
Expected Outcomes of the Project
Maps representing potential vulnerability for groundwater resources will be generated through this project. These maps would be useful for future studies and understanding groundwater features of the study site. They would show vulnerability and possible impacts of toxic substances from gas fracking.
A consolidated report would be created under this project to guide policymakers and shale gas extracting firms. It is expected that the final project outcomes used to address clean water concerns and other environmental threats raised by communities and other stakeholders in Western Australia.
The project is expected to provide vital visual tools to be included in other databases. These maps and other GIS results will help the public to understand how gas fracking could possibly affect groundwater resources and other environmental resources.
In addition, the 3D GIS maps of contaminated groundwater zones may be useful for the water resource management authorities to take steps in purification of groundwater. Groundwater engineers can use outcomes to guide their water treatment methods and processes.
Reference List
Amer, R., Ofterdinger, U. & Ruffell, A. 2012, Mapping Groundwater Contamination Using Airborne and Surface Geophysical Techniques. Web.
Altobi, Y. & Bailey, D., The use of GIS 3D tools to tackle ground water contamination at Bemidji, MN. Web.
Arias-Estévez, M., López-Periago, E., Martínez-Carballo, E., Simal-Gándara, J., Mejuto, J-C. & García-Río, L. 2008, “The mobility and degradation of pesticides in soils and the pollution of groundwater resources’, Agriculture, Ecosystems & Environment, vol. 123, no. 4, pp. 247-60.
AWE 2015, Onshore Perth Basin Exploration – Drover Exploration Well. Web.
Bashir, I. Y., Yusoff, I. M. & Rindam, M. 2014, ‘Integrating Geophysical Data and Three-Dimensional GIS for Groundwater Modelling and Simulation – A Review’, Pensee Journal, vol. 76, no. 1, pp. 147-159.
Kheder, K. 2014, ‘Modeling of Groundwater Behavior using GIS and ModFlow Software : Case study of Al Kharj Region – Al Kharj Saudi Arabia’, International Journal of Scientific & Engineering Research, vol. 5, no. 5, pp. 460-465.
Riaz, S. 2014, Western Australian council concerned about water contamination by fracking. Web.
Saidi, S., Bouri, S. & Dhia, H. B. 2010, ‘Groundwater vulnerability and risk mapping of the Hajeb-jelma aquifer (Central Tunisia) using a GIS-based DRASTIC model’, Environmental Earth Sciences, vol. 59, no. 7, 1579-1588.
United States Geological Survey, Development of a GIS for Analyzing and Mapping Ground-Water Elements Related to Coal-Bed Methane Production.
Wycisk, P., Weiss, H., Kaschl, A., Heidrich, S. & Sommerwerk, K. 2003, ‘Groundwater pollution and remediation options for multi-source contaminated aquifers (Bitterfeld/Wolfen, Germany)’, Toxicology Letters, vol. 140–141, pp. 343-51