GSS Dataset Analysis Using SPSS Essay

Exclusively available on Available only on IvyPanda® Made by Human No AI

Introduction

This paper is a report of a statistical analysis of two variables of a data set obtained from the General Social Survey (GSS) database. It includes the statistical assumptions of the test, SPSS syntax and output including the mean, median, mode, range, minimum, maximum and standard deviation of the two variables, and a chart describing that data.

Statistical assumptions of test

There are a couple of assumptions of the test. One assumption is that the populations represented by the sample data have specific traits and that these samples are obtained under specific conditions (General Social Survey, n.d.; Somekh & Lewin, 2005). It is also assumed that the data are sampled independently from normal distribution.

SPPSS syntax and output

Syntax

The SPSS syntax below is used to generate the standard measures of central tendency and dispersion, the frequency tables, and graphs (Green & Salkind, 2005).

FREQUENCIES VARIABLES=marital age

/STATISTICS=STDDEV RANGE MINIMUM MAXIMUM MEAN MEDIAN MODE

/BARCHART FREQ

/ORDER=ANALYSIS.

Statistics calculations

MARITAL STATUSAGE OF RESPONDENT
NValid35523527
Missing732
Mean2.4548.44
Median2.0047.00
Mode150
Std. Deviation1.65317.254
Range471
Minimum118
Maximum589

Frequency Tables

The following are the frequency tables for the variables marital status and age of respondents generated using SPSS and the GSS dataset.

Marital status

FrequencyPercentValid PercentCumulative Percent
ValidMARRIED174248.949.049.0
WIDOWED3038.58.557.6
DIVORCED53915.115.272.7
SEPARATED1163.33.376.0
NEVER MARRIED85223.924.0100.0
Total355299.8100.0
MissingNA7.2
Total3559100.0

Age of respondent

FrequencyPercentValid PercentCumulative Percent
Valid186.2.2.2
1932.9.91.1
20341.01.02.0
21361.01.03.1
22431.21.24.3
23561.61.65.9
24651.81.87.7
25451.31.39.0
26601.71.710.7
27661.91.912.6
28712.02.014.6
29621.71.816.3
30531.51.517.8
31702.02.019.8
32471.31.321.2
33571.61.622.8
34752.12.124.9
35752.12.127.0
36732.12.129.1
37712.02.031.1
38722.02.033.1
39581.61.634.8
40641.81.836.6
41641.81.838.4
42591.71.740.1
43591.71.741.8
44772.22.243.9
45671.91.945.8
46762.12.248.0
47762.12.250.2
48691.92.052.1
49702.02.054.1
50812.32.356.4
51742.12.158.5
52691.92.060.4
53681.91.962.4
54712.02.064.4
55611.71.766.1
56732.12.168.2
57742.12.170.3
58431.21.271.5
59371.01.072.6
60742.12.174.7
61641.81.876.5
62611.71.778.2
63441.21.279.4
64441.21.280.7
65531.51.582.2
66441.21.283.4
67361.01.084.5
68351.01.085.5
69391.11.186.6
70351.01.087.6
7132.9.988.5
7231.9.989.3
7333.9.990.3
74381.11.191.4
7529.8.892.2
7629.8.893.0
7727.8.893.8
7827.8.894.5
7920.6.695.1
8023.6.795.7
8119.5.596.3
8218.5.596.8
8320.6.697.4
8416.4.597.8
859.3.398.1
8610.3.398.4
8712.3.398.7
889.3.399.0
89 OR OLDER371.01.0100.0
Total352799.1100.0
MissingNA32.9
Total3559100.0

Bar chart to describe the data

Age of respondent
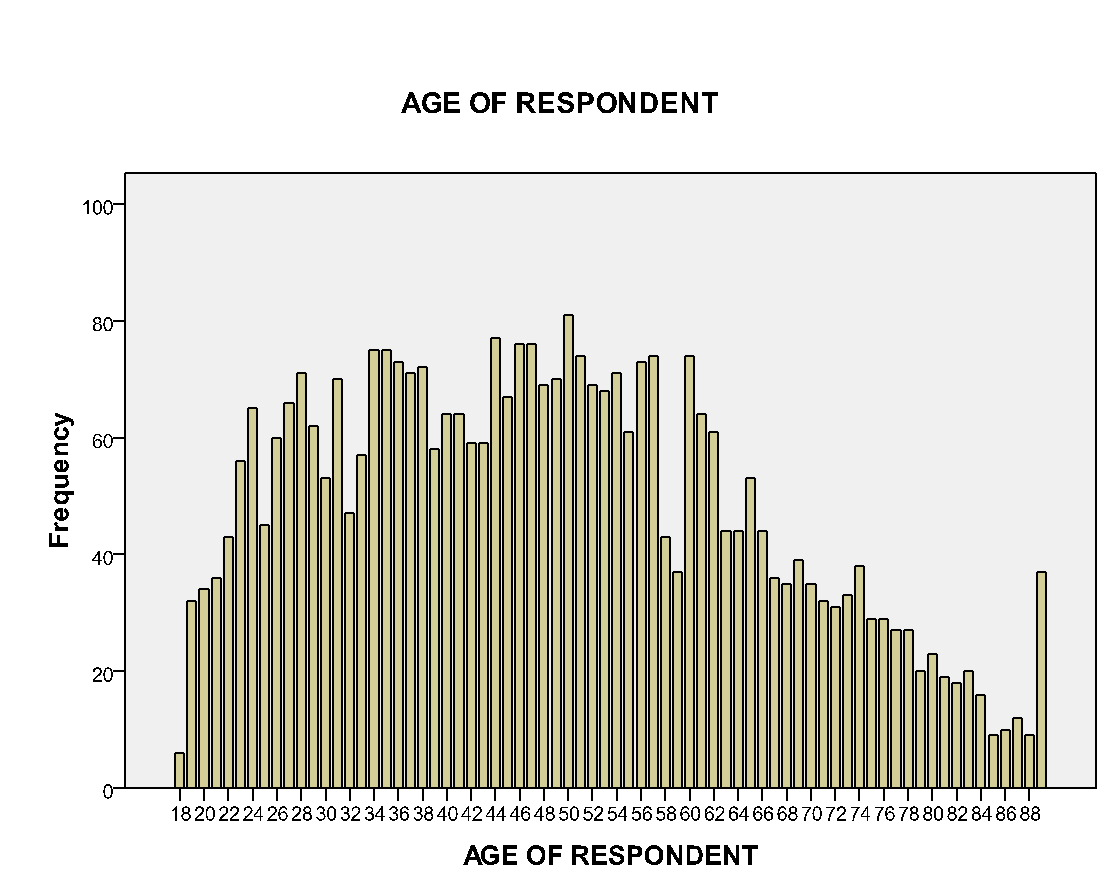
Age of respondent

The bar graph for age of respondent is a histogram. As Huizingh (2007) highlights, a bar chart is inappropriate for continuous variables because they often have several varying values. The highest number of persons (respondents) were aged 50 years, the least number of persons were 18 years old.

Marital status
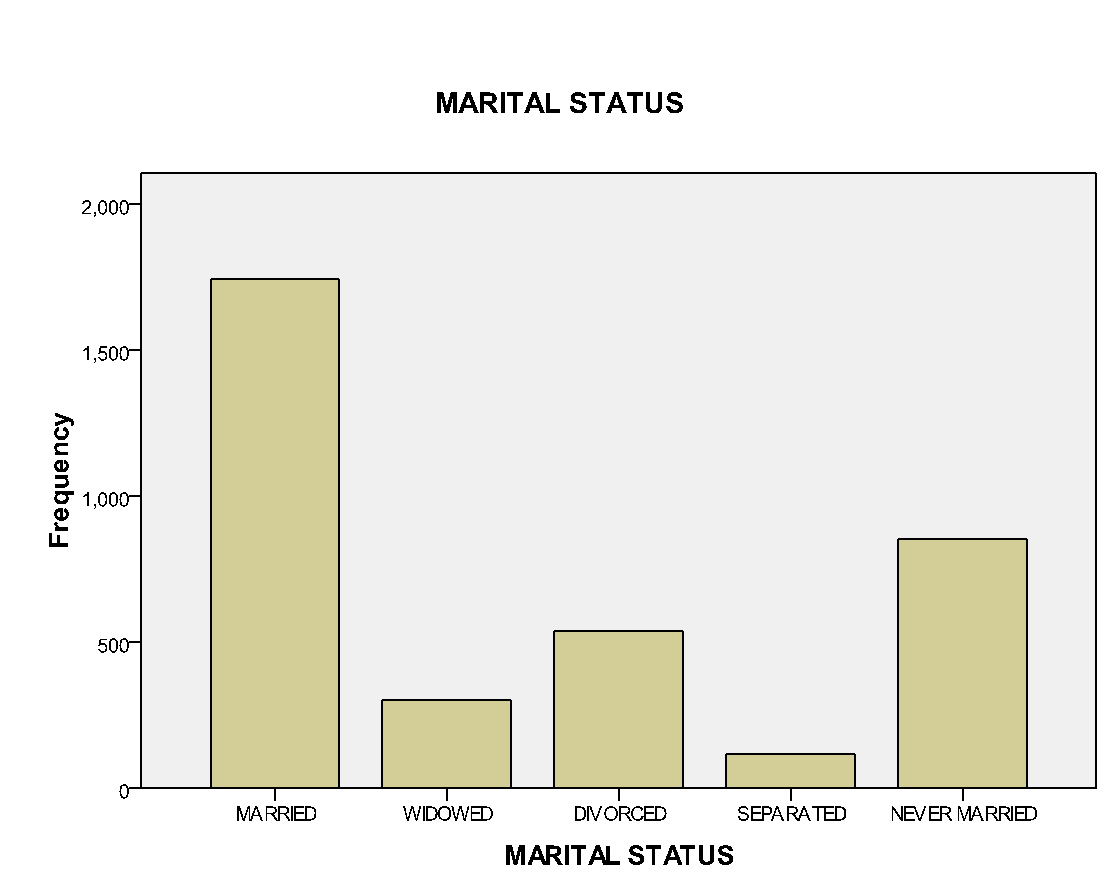
Marital status

The graph shows that married persons constituted the highest population, while separated persons were the least.

Conclusion

This report has utilized a data set obtained from the General Social Survey to show the standard measures of central tendencies and dispersions of the data. These statistical aspects were calculated using the SPSS application. The statistical assumptions of the test were mentioned and a bar chart was used to describe data.

References

General Social Survey. (n.d.), GSS 2008 Cross-Section and Panel Merged (2010). Web.

Green, S. B. & Salkind, N.J. (2005). Using SPSS for Windows and Macintosh: analyzing and understanding data, Vol. 1, Pearson/Prentice Hall, Upper Saddle River, NJ.

Huizingh, E. (2007). Applied statistics with SPSS. SAGE, London

Somekh, B. & Lewin, C. (2005). Research methods in the social sciences, SAGE, London.

More related papers Related Essay Examples
Cite This paper
You're welcome to use this sample in your assignment. Be sure to cite it correctly

Reference

IvyPanda. (2022, January 11). GSS Dataset Analysis Using SPSS. https://ivypanda.com/essays/gss-dataset-analysis-using-spss/

Work Cited

"GSS Dataset Analysis Using SPSS." IvyPanda, 11 Jan. 2022, ivypanda.com/essays/gss-dataset-analysis-using-spss/.

References

IvyPanda. (2022) 'GSS Dataset Analysis Using SPSS'. 11 January.

References

IvyPanda. 2022. "GSS Dataset Analysis Using SPSS." January 11, 2022. https://ivypanda.com/essays/gss-dataset-analysis-using-spss/.

1. IvyPanda. "GSS Dataset Analysis Using SPSS." January 11, 2022. https://ivypanda.com/essays/gss-dataset-analysis-using-spss/.


Bibliography


IvyPanda. "GSS Dataset Analysis Using SPSS." January 11, 2022. https://ivypanda.com/essays/gss-dataset-analysis-using-spss/.

If, for any reason, you believe that this content should not be published on our website, please request its removal.
Updated:
This academic paper example has been carefully picked, checked and refined by our editorial team.
No AI was involved: only quilified experts contributed.
You are free to use it for the following purposes:
  • To find inspiration for your paper and overcome writer’s block
  • As a source of information (ensure proper referencing)
  • As a template for you assignment
1 / 1