The report covers a dataset for a healthy lifestyle in the top 44 cities in 2021, including ten healthy living metrics. The metrics were as follows sunshine hours (City), cost of a bottle of water (City), obesity levels (Country), life expectancy (years) (Country), pollution (Index score) (City), annual average hours worked and happiness levels (Country). In addition, healthy living metrics also entailed outdoor activities (City), number of take-out places (City), and cost of a monthly gym membership (City) (‘‘Healthy lifestyle cities report 2021’’). The research question entails comparing the variation of ten healthy lifestyle metrics in the top 44 cities using descriptive statistical methods.
Step 2: Descriptive Statistics of Healthy Lifestyle Cities Dataset
Table 1. Summary Statistics for Healthy Lifestyle in Top 44 Cities Dataset
In the top 44 cities, the mean for various metrics includes sunshine hours 2194.8, cost of a bottle of water 1.17, obesity levels 0.22, life expectancy 78.18, pollution 49.96, and annual average hours worked 1254.68. In addition, the mean of happiness level is 6.44, outdoor activities 213.98, the number of take-out places 1443.11, and the mean cost of monthly membership 40.42. Based on the mode, it is depicted that most of the top cities experience 1662 sunshine hours, £1.6 cost of a bottle of water, and a rate of obesity levels of 0.362%. The majority of the top cities’ population have a life expectancy of 78.18 years, with happiness levels of 6.94 and outdoor activities of 223.
Step 3: Charts for Health Lifestyle Cities Dataset

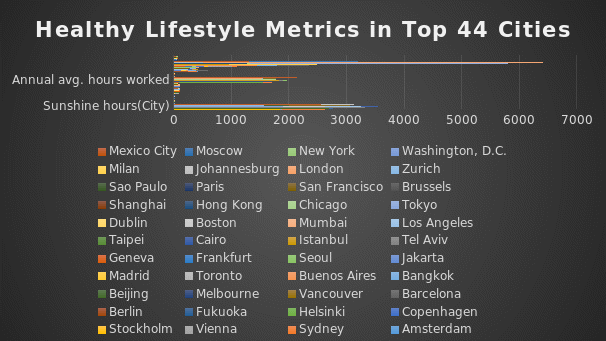
The clustered bar chart shows that the top cities experience sunshine hours of more than 1662, annual average hours worked of more than 1254 hours. The number of take-out places is 1443 on average across cities, while there are low levels of obesity and happiness levels. The pollution index is at 49.96 among cities, while life expectancy indicates that most of the population grows to an older age.

Step 4: Confidence Interval for the Mean of Variables in Health Lifestyle Cities Dataset
Table 2. Confidence Interval for the Measure of Variables in Healthy Lifestyle Dataset
Based on the quantitative data provided, the best method for analyzing the data is through the use of descriptive statistics. The method is suitable as it allows for basic information regarding variables in the dataset while highlighting potential relationships between them. It is also possible to display the dataset pictorially or graphically and obtain measures of central tendency, association, and dispersion through descriptive statistics. For the mean of variables in the dataset of a healthy lifestyle in the top 44 cities, a confidence interval level of 95.0% was used to represent the range of scores essential for the generalization of results. The confidence levels of variables were sunshine hours 199.15, 0.22 cost of a bottle of water, 0.22 obesity levels, 1.61 life expectancy, 6.97 pollution, and 227.7 annual average hours worked, and 0.30 happiness levels. Outdoor activities had confidence levels of 38.67, while the number of take-out places was 422.23 and 4.56 for the cost of a monthly gym membership.
Step 5: Hypotheses for Testing Datasets
- H1: An increase in pollution causes a reduction in life expectancy.
- H2: Outdoor activities influence obesity levels by reducing the chances of becoming obese.

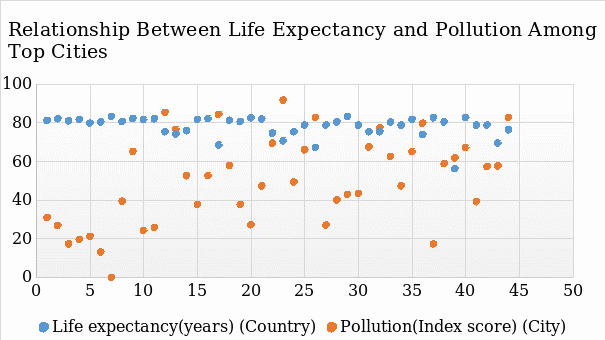
The outcome of hypothesis H1 is shown above for life expectancy and pollution. The bar chart shows that life expectancy is reduced with increased pollution. Pollution forms an integral determinant of human health as it affects body systems and causes diseases. Cities have a high rate of air pollution due to industrial emissions that influence human health negatively. Outdoor activities such as physical activity promote well-being and reduce obesity. According to hypothesis H2, an increase in outdoor activities alleviates obesity conditions in cities.
Reference
Healthy lifestyle cities report 2021. (2021). Kaggle: Your Machine Learning and Data Science Community.