Introduction
Hypothesis testing is a complicated procedure that builds on the knowledge acquired during statistics studies. It begins with the identification of the null hypothesis and the alternate hypothesis that challenges it. Then, the researcher has to select the confidence level for the test. Smaller values are better for trials where errors cannot be tolerated. The next step is the identification of the test statistic that will be investigated and of its distribution. An appropriate method is applied based on the latter, and the result allows the researcher to reject, or fail to reject, the null hypothesis based on whether the resulting value is in a specific region. The conclusion is then restated in accessible terms that relate to the original claim.
Null and Alternate Hypotheses
In this assignment, the researcher is trying to prove that his or her treatment produces better results than the absence of any interventions. As such, the null hypothesis will be that the new procedure does not increase the proportion of people whose cholesterol decreases compared to a lack of treatment. The alternate hypothesis will be that the new treatment increases the proportion of people whose cholesterol decreases compared to patients who do not receive treatment. Medicine is a field where results should undergo rigorous testing before being accepted, so it is prudent to select a confidence level at 0.01. With these conclusions reached, the test may continue into the next steps.
Test Statistic
As mentioned above, the hypotheses use the proportion of patients whose cholesterol decreases, as a result of the treatment or otherwise. As such, a determination of the relevant statistic and the value against which it will be compared is necessary. The population proportion is unknown, but according to Triola (2015), we may use the sample proportion as the best point estimate. As such, the population proportion of people whose cholesterol decreased without treatment may be estimated at 30/50 ≈ 0.517. We will be testing this statistic against the sample proportion for the people who received the treatment, which is 38/56 ≈ 0.679. We know that the values are distributed normally, and therefore, we can proceed using P-values.
P-Value Calculation
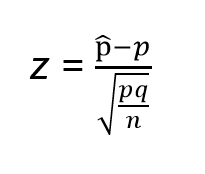
We know n, which is 56 in this case, p, which is 0.517, q, which is 1 – 0.517 = 0.483, and p̂ = 0.679. To find the P-value, we need z, which, according to Triola (2015), is calculated as follows:

By substituting the relevant values into the equation, we obtain a value for z equal to 2.426. Using the tables provided in the book by Triola (2015), we can find the P-value, asserting that the hypothesis is one-tailed because we are testing to see whether the proportion is greater than its population equivalent. We obtain a P-value that is equal to 0.008 as a result of the calculation.
Null Hypothesis Rejection
As can be seen in the calculations above, the P-value is 0.008, while the confidence level is 0.01. The P-value is lower than the confidence level, and therefore, we can reject the null hypothesis. There is sufficient evidence to warrant rejection of the claim that the treatment does not cause the proportion of people whose cholesterol decreases to become higher than that in people who do not receive treatment. In other words, there is evidence that the treatment is effective, and further investigations into its applicability are warranted.
Reference
Triola, M. F. (2015). Essentials of statistics (5th ed.). Boston, MA: Pearson.