Introduction
Nowadays, Product Positioning Maps are actively used by marketers in many organizations. Product Positioning Map is a framework that is used to identify the position of a certain product in the market (Wang, 2015). Depending on the features that are shown in the map, it is possible to reveal the strengths and drawbacks of the product, and identify what should be done to improve its position in the market.
Information on Quality, Price, Calories, and Nutrition of Candy Bars
In order to design a perceptual map based on the quality, price, calories, and nutrition of the products, Table 1 was created.
Table 1. Nutrition Facts for Chocolate Products.
The table contains all the information about prices and nutrition facts of 13 types of candies. The data is borrowed from the websites of the companies that produce these chocolate sweets, such as Mars, Inc., the Hershey Company, Ferrara Candy Company, and Nestle Global, and from the stores that sell these products. The column “Quality” shows the percentage of sugar in the candies. It is worth to mention that the quality of candies depends on the amount of sugar in them. Sugar may bring negative affect to our body, especially when it comes from refined forms such as glucose or corn syrup (Perlmutter & Loberg, 2018). Therefore, the more sugar in a product, the lower the quality of it. The column “Nutrition” is ranked according to the number of calories in each product.
Each company that produces candies can find some useful information in Table 1. For example, Hershey’s company that produces Mr. Goodbar, Krackel, Hershey’s Kiss and Almond Joy candies, can compare the amount of sugar in the products of their company and products of their competitors. Nowadays, there are a lot of people who are devotees of healthy nutrition, who take care of their health and pay strong attention to what they eat.
Therefore, people tend to read the nutrition facts about the products and try to choose the ones that contain less sugar. As a result, it is extremely important for companies to make their products healthier. In addition, with the help of Table 1, Hershey’s company can analyze the prices, revealing which products are cheaper and which are more expensive. It is also significant since for the majority of people price remains the most determining factor when they are choosing products. In general, all presented information, including the column of quality, price, calories, and nutrition is useful. It helps to understand the whole picture of candies’ production and position of Hershey’s company in the market, its strengths, and weaknesses.
As for me, I prefer the products of Mars Inc. because I think it has the best taste. Moreover, the company follows the principles of sustainable marketing, which means that the production of chocolate at the company is held in accordance with the principles of environment protection. I personally more trust the company that cares about the environment and our future generations. However, the products of Marc Inc. contain more sugar compared to the candies of the other companies. Therefore, it is also necessary to control the consumption of chocolate products by people themselves.
Hershey’s Product Positioning Map
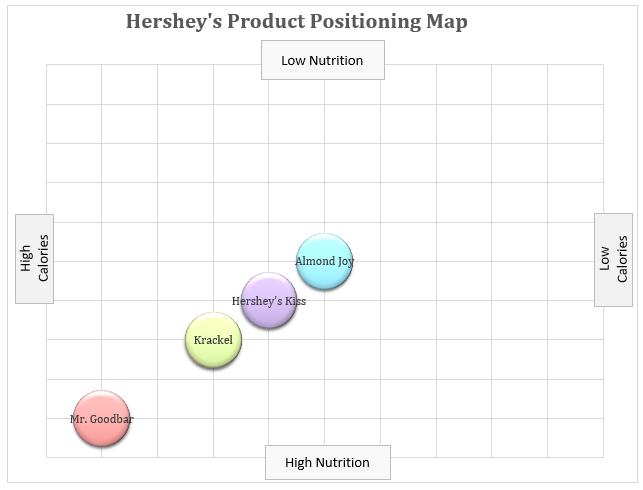
Based on the information provided below, the Hershey’s Product Positioning Map was created. In order to improve the quality of Hershey’s products, I would recommend reducing the amount of sugar in candies and increasing the nutritional value of the products. It would be productive to analyze how it is possible to achieve without a significant price increase. In general, the prices for Hershey’s candies are not high.
However, as one of the consumers of chocolate products, I think that the taste of Hershey’s chocolate is not as good as the taste of products of other chocolate companies. Therefore, this is another thing that the company should work on. In addition, even though Hershey’s announced its sustainability policy, there is still a room to improve it. I think that constant care of the environment and continuous efforts made in order to protect our planet should be the most significant aspects for any company.

References
Perlmutter, D., & Kristin, L. (2018). Grain brain: The surprising truth about wheat, carbs, and sugar – Your brain’s silent killers (1st revised ed.). New York, NY: Little, Brown Spark Hachette Book Group.
Wang, C. (2015). A market-oriented approach to accomplish product positioning and product recommendation for smart phones and wearable devices. International Journal of Production Research, 53(8), 2542-2553.