Purposes
The experiment aims to achieve three main purposes:-
- Compare the growth of SCOBY in black tea, green tea, chamomile tea, and distilled water.
- Examine the growth of SCOBY in various substrates over time.
- Observe the growth of SCOBY influences pH change in different substrates.
Background
Kombucha is a product of a fermentation process driven by the symbiotic culture of bacteria and yeast (SCOBY). Usually, fermentation of sweetened black tea for several weeks using SCOBY forms kombucha. The common forms of yeast and bacteria are and Zygosaccharomyces and Gluconacetobacter species respectively (Jayabalan, Malini, Sathishkumar, Swaminathan, & Yun, 2010). The yeast in SCOBY ferments the sugar in tea to produce alcohol while the bacteria oxidize the alcohol to produce acetic acid and other types of organic acids. According to Nguyen, Dong, Nguyen, and Le (2015), SCOBY produces acetic acid and ethanol, which have antibacterial activity. Hence, acetic acid produced is beneficial in the production of kombucha because it prevents the growth of other bacteria.
Hypotheses
The null hypotheses (H0)
- The means of SCOBY growth in black tea, green tea, chamomile tea, and distilled water are not significantly different.
- The means of SCOBY growth in black tea and distilled water are not significantly different.
The alternative hypotheses (H1)
- The means of SCOBY growth in black tea, green tea, chamomile tea, and distilled water are significantly different.
- The means of SCOBY growth in black tea and distilled water are significantly different.
Results
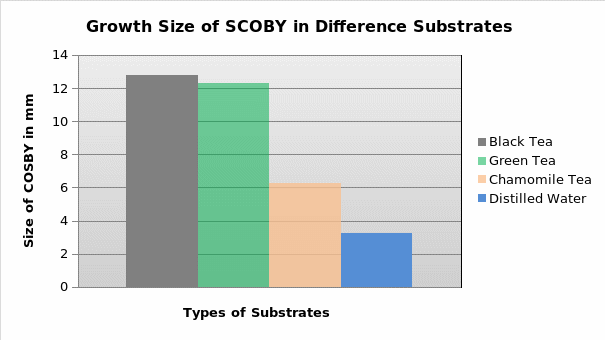
Table 1: Pooled class results showing the growth size of SCOBY in mm

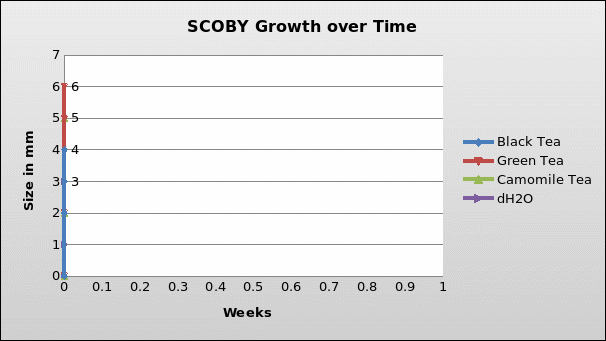
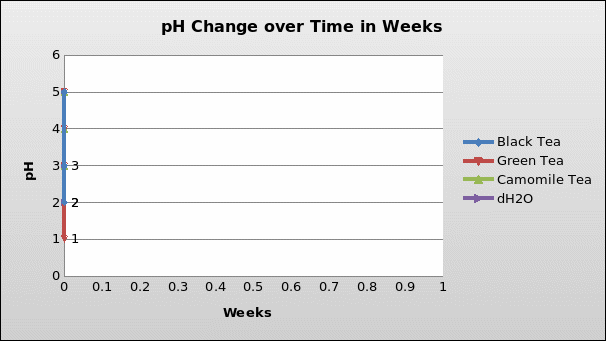
Table 2: Data of SCOBY growth and pH change over time


Table 3: Descriptive Statistics
The descriptive statistics indicate that there are apparent differences in the means of SCOBY growth in different substrates.
Table 4: Hypothesis Test
The hypothesis test used a two-tailed test because the test examines the differences among means of SCOBY growth in black tea, green tea, chamomile tea, and distilled, which is a bidirectional difference.
The ANOVA test rejects the null hypothesis that the means of SCOBY growth in black tea, green tea, chamomile tea, and distilled water are not significantly different. Hence, the hypothesis test holds that the means of SCOBY growth in black tea, green tea, chamomile tea, and distilled water are significantly different, F(3,60) = 3.582, p = 0.0188.
The t-test rejects the null hypothesis because the p-value is less than 0.05. In this view, the hypothesis test holds that the means of SCOBY growth in black tea and distilled water are significantly different, t(15) = 4.71, p = 0.0003.
Discussion
The results show that the pH of the substrates in the test tubes decreased with time. The alkaloid contents such as theobromine, caffeine, theophylline, and theine influence SCOBY growth, and consequently determine the decrease in pH (Kaczmarczyk & Lochynski, 2014). The decrease in pH is due to the production of acetic and other organic acids during the fermentation process. In the symbiotic relationship, yeast acts on the sugar to form alcohol while bacteria act on the produced alcohol to form acetic acid, which is responsible for the decrease in pH with time (Jayabalan et al., 2010). Gluconacetobacter species of bacteria are the ones that oxidize ethanol to acetic acid during the process of fermentation; hence, reducing the accumulation of ethanol. The pH of SCOBY grown in black tea decreased to 1 because it has the highest content of alkaloids, which favors its growth. The lower content of alkaloids in green tea, chamomile tea, and distilled water reduced the rate of SCOBY growth and consequently reduced pH change.
Fermentation is a delicate biological process that is susceptible to many factors. Results of the replicates exhibit some differences that emanate from different factors in the test tubes. A significant factor is the population of yeast and bacteria in the piece of SCOBY used in each test tube. The variation in the population of yeast and bacteria explains the existence of the difference in the growth of SCOBY. A piece of SCOBY with a large population would grow faster and bigger than a piece of SCOBY with a small population. Another significant factor is the level of ventilation in the test tubes. Nguyen et al. (2015) state that the process of fermentation requires adequate ventilation for it entails the production of carbon dioxide and consumption of oxygen. In airtight test tubes, oxygen is inadequate, and carbon dioxide accumulates to levels that hinder the growth of SCOBY.
The possible source of error in the experiment is the measurement of SCOBY growth. Given that SCOBY is in a test tube and the solution form, measurement of its growth is prone to errors. Contamination of the substrate could also be a source of error since other microbes influence the growth of SCOBY for they compete for nutrients in the test tube. In this view, the existence of other microbes affects the process of fermentation resulting in erroneous outcomes.
Kombucha is a healthy drink because it improves stomach and intestinal health. According to Nguyen et al. (2015), kombucha has antimicrobial activity because SCOBY colonizes the gut and produces organic acids that prevent the growth of other microbes such as bacteria and yeast. From the experiment, it is evident that the pH of the kombucha decreased from 5 to 1 in black tea, which is the major substrate. However, kombucha tea can be harmful to humans when there is microbial contamination or corrosion of lead containers resulting in lead poisoning.
References
Jayabalan, R., Malini, K., Sathishkumar, M., Swaminathan, K., & Yun, S. (2010). Biochemical characteristics of tea fungus produced during Kombuch fermentation. Food Science and Biotechnology, 19(3), 1-5.
Kaczmarczyk, D., & Lochynski, S. (2014). Product of biotransformation of tea infusion: Properties and applications. Polish Journal of Natural Sciences, 29(4), 381-392.
Nguyen, N., Dong, N., Nguyen, H., & Le, P. (2015). Lactic acid bacteria: promising supplements for enhancing the biological activities of Kombucha. SpringerPlus, 4(91), 1-6.