Correlation between Ice-cream and Drowning
Temperature changes influence Ice-cream sales and the occurrence of drowning alike. According to Schober, Boer & Schwarte (2018), ice-cream sales increases with the temperature rise. Similarly, hot weather is likely to upsurge drowning occurrences—as a variable, increasing temperature surges drowning (Sharma et al., 2020). Given both ice scream sales and the occurrence of drowning correlate positively with temperature, it implies a positive correlation between ice scream sold per month and the number of drownings occurring in the particular month.
Monthly ice-cream Sales Versus Drowning
The strong positive correlation does not infer causality. The correlation between these monthly ice sales and monthly drowning occurrence can give a reasonable forecasting model not because ice-cream sales cause drowning but because people consume more ice cream in hot weather as they go swimming. Thus, the two variables are both caused by another third variable, temperature, as explained by Schober, Boer & Schwarte (2018); Sharma et al. (2020). This is a typical example of a confounding case, whereby an omitted cause shifts in at least predictor variable both response variables. There is a mere direct link between ice-cream sales and downing—this is the best explanation of correlation.
Fire Engine Versus Amount of Damage Caused on Fire
The ability to put off fire depends on the sufficiency of the number of firefighting engines. Yang and Liu (2017) have noted that inadequate fire engines are likely to be sufficient to extinguish any serious fire. Thus, the relationship between the number of engines used and the extent of damage caused to fire is strongly positive. This implies that the damage cannot be wide if less fire engines are deployed.
Flights from San Luiz to Obispo

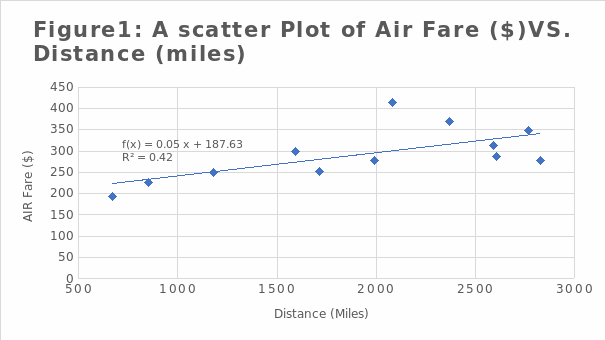
The data set provided by the Professor with columns including destination, airfare and distances is copy-pasted to Excel. Distance is treated as an independent variable, whereas airfare is the dependent variable. Logically and from theory, fare increases with an increase in distances. The output from the excel commands is summarized in figure 1. From figure 1, we can determine the Pearson correlation by finding the square root of R-squared (0.423). Thus, Pearson correlation (r) = √0.423 = 0.650. This correlation is approaching positive 1. Thus, there is a strong positive correlation between distance and air fare for flights from San Luiz to Obispo.
References
Schober, P., Boer, C., & Schwarte, L. A. (2018). Correlation coefficients: appropriate use and interpretation.Anesthesia & Analgesia, 126(5), pp. 1763-1768. Web.
Sharma, S., Blagrave, K., Watson, S. R., O’Reilly, C. M., Batt, R., Magnuson, J. J.,… & Weyhenmeyer, G. A. (2020). Increased winter drownings in ice-covered regions with warmer winters.PloS one, 15(11), e0241222. Web.
Yang, Z., & Liu, Y. (2017). Using Statistical and Machine Learning Approaches to Investigate the Factors Affecting Fire Incidents.