Introduction
As a publicly traded brand management firm, Iconix Brand Group focuses on acquiring, licensing, and promoting a diversified roster of consumer brands. A review of the company’s income statement, balance sheet, and cash flow statement may shed light on its financial well-being. Both horizontal and vertical assessments of the income statement and balance sheet may be used to evaluate the company’s financial performance over time and to determine the assets, liabilities, and equity that make up the business (Anggraini, 2022).
Revenue growth drivers and the quality of revenue sources should be identified and evaluated as part of the investigation. Similarly, it is essential to identify and evaluate the quality of the critical drivers of earnings and earnings growth. Finally, other quantitative and qualitative risk factors should be outlined and evaluated.
Horizontal and Vertical Analysis
Income Statement
Horizontal analysis is a technique for identifying a company’s financial performance patterns by comparing financial statement data from multiple time periods. Financial statement data may be vertically expressed as a percentage of a base amount to facilitate comprehension of each line item (Anggraini, 2022).
As indicated by Figure 1, Iconix Brand Group’s licensed product sales increased by 22.6%, from $332,390 in 2010 to $406,940 in 2014, over five years. The income from extracurricular activities has increased significantly, from $169 in 2010 to $54,303 in 2014. Figure 1 shows that in 2014, the pay expanded from $332,559 in 2010 to $461,243. This is an increment of 38.6% over five years.
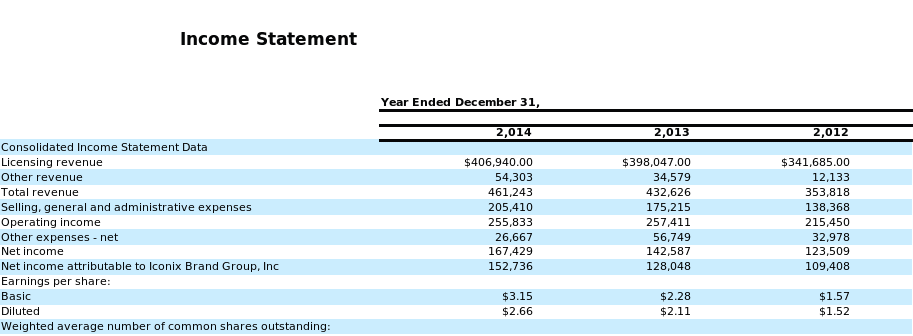
Over a similar period, selling, general, and managerial costs expanded by 48.4%, from $138,532 in 2010 to $205,410 in 2014 (Figure 1). Functional pay went from $209,715 to $258,833 between 2010 and 2014, remaining steady. From 2010 to 2014, permitted pay accounted for somewhere between 96.7% and 88.2% of all income for Iconix Brand. The figure above shows that other payments addressed 11.8% of all income in 2014, up from under 1% in 2010. In the past five years, selling, general, and managerial costs have reached the midpoint of around 44% of deals.
Balance Sheet
Figure 2 shows that all resources expanded from $1.95 billion in 2010 to $2.87 billion in 2014, showing a development of 47.69% over the five years. The money surplus diminished from $118.64 million in 2010 to $128.02 million in 2014, lessening by 7.9% over the five years. Figure 2 shows that working capital diminished from $125.91 million in 2010 to $248.14 million in 2014, representing an increase of 97.39% over the five years.

The examination demonstrates that the money balance diminished from 6.08% in 2010 to 4.45% in 2014 of total resources. Working capital expanded from 6.46% in 2010 to 8.63% in 2014 of total resources. Brand names and different intangibles, net expanded from 71.69% in 2010 to 70.48% in 2014 of absolute resources. In absolute terms, long debt obligation expanded from 29.91% in 2010 to 48.43% in 2014. Absolute investors’ value diminished from 58.36% in 2010 to 36.68% in 2014 of all our resources.
Cash Flow Statement
The accompanying income explanation was ready for the firm for the years ending December 31st, 2014, 2013, and 2012. Cash is gained and paid out through business tasks, speculations, and funding, which are defined in the explanation. Working activities reveal that the partnership got $162,521, $203,152, and $206,924 in 2014, 2013, and 2012, respectively. Here, as well, are the amendments expected to change over net gain into net income from functional activities.
The firm burned through $33,662 in 2014, $163,351 in 2013, and $244,869 in 2012 on speculations such as property and hardware buys, consolidations and acquisitions, and joint ventures, separately, as displayed in the money management section. From the data in Figure 3, the share and repurchases in 2012, 2013, and 2014 were $342,086, $119,658, and $267,938, respectively.

Key Sources of Revenue
Given the pay proclamation information, licensing revenue is Iconix Brand Group, Inc.’s primary source of income. Permitting income has reliably been the most significant source of income throughout recent years, with $406,940,000 in 2014, representing 88.2% of total income. The nature of income sources can be evaluated by inspecting their maintainability, consistency, and broadening levels. Permitting income is a more reasonable and unsurprising source of income as it has reliably been the most significant in recent years (Berthilde & Rusibana, 2020). It is likely to continue being so, given the organization’s emphasis on procuring and dealing with an enhanced range of buyer brands.
Iconix Brand Group licenses its brand names to retailers and manufacturers for use in exchange for monetary compensation. A substantial rise in licensing income, a significant contributor to profitability, from $341,685.00 in 2012 to $406,940.00 in 2014. Iconix Brand Group’s income comes from additional services like brand management and consultancy. The rise in other income was particularly impressive, from $12,133 in 2012 to $54,303 in 2014. There was an apparent rise in capital expenditures as SG&A costs doubled from 2012’s $138,368.00 to 2014’s $205,410.00.
Generally, it seems that Iconix Brand has been earning substantial sums of money. Over the three years, the organization’s income developed consistently because of expansions in permitting and other income. Additionally, selling general and organization costs increased, indicating expenditures on extending the firm (Dang et al., 2020). Despite an increase in “different costs” in 2013, the firm could reduce these in 2014, resulting in great cost to the executives.
Other Quantitative and Qualitative Risk Indicators
Iconix Brand Group may have different quantitative and qualitative risk indicators. The company’s income is disproportionately reliant on a small number of brands. If these brands lose popularity or success, the company’s profits and financial performance may be negatively impacted. Iconix Brand Group confronts competition from other licensors and brand owners in the fashion business, where competition is fierce (Berthilde & Rusibana, 2020). Factors including price, marketing methods, and the strength of the company’s brand portfolio may have influenced the company’s capacity to compete and keep market share.
Changes in consumer buying habits, interest rates, and currency fluctuations are all macroeconomic variables that affect Iconix Brand Group’s financial performance. The company’s operations and financial performance might be impacted if the economy experiences a downturn or a period of instability (Berthilde & Rusibana, 2020). Management changes significantly affect the company’s strategies and operations.
Conclusion
Iconix Brand Group’s financials show that licensing revenue has contributed significantly to the company’s rapid revenue growth over the last five years. The organization’s functional pay has remained steady despite expanding selling, general, and administrative costs. Long-term debt obligations have expanded over the past five years as the organization’s resources have increased significantly. Both the cash on hand and the proportion of equity to total assets decreased. The cash flow statement shows that the company has generated net cash from its operations during the last three years, showing its viability.
References
Anggraini, N. T. (2022). Analysis of financial statements based on financial ratio and vertical-horizontal method in PT Unilever, Tbk, 2016-2017 period. Journal of Social Science, 3(1), 171–176. Web.
Berthilde, M., & Rusibana, C. (2020). Financial statement analysis and investment decision making in commercial banks: A case of Bank of Kigali, Rwanda. Journal of Financial Risk Management, 09(04), 355–376. Web.
Dang, H. N., Nguyen, T. T., & Tran, D. M. (2020). The impact of earnings quality on firm value: The case of Vietnam. The Journal of Asian Finance, Economics, and Business, 7(3), 63–72. Web.