Executive summary
The findings retrieved from the survey conducted to determine the different factors which could affect the Cingular wireless demand. As discussed in the research’s methodology, the data obtained from this survey will be analysed by using SPSS.
The report starts by identifying the sample size’s demographic profile. It will then discuss the findings obtained from the surveys main points, namely coverage area customers, ability to make or receives calls from anywhere, getting few calls dropped and good voice quality. It moves to discuss these major findings in close relation to the theories of consumer psychology and behaviour patterns with regards to Cingular consumption. These are all summarized and reiterated in the concluding section of this report.
Data was collected using survey of research and it followed with an analysis of the results. It is said that results are reliable in the accuracy of the actual measuring instrument, where the sample group mostly represent the population. Regarding the validity of the findings, the results would decipher the analysis of the data collected and measured, providing a detailed evaluation of the findings with answering research questions.
The last part of the survey questionnaire was created to gather information on the demographic characteristics of the survey’s respondents. This information was then utilized for classification purposes and is illustrated by the figures below. A total of 402 questionnaires were sent to customers, convenience sampling was used to reflect the personal opinion of respondents who had wireless services.
Background
From time to time, there are exceptional people that come into the world and revolutionize the way we live and think. The seeds they sow multiply infinitely and they all start with a brilliant idea. Alexander Graham Bell invented the telephone, making connections between people a dial away. Thomas Alva Edison’s creativity made electricity available to homes and commercial establishments that greatly aided in the early industrialization of the modern world.
With the interconnectivity by telephone and movement of commodities facilitated by mass transport, commerce had an unprecedented boom. People were having better things that were coming from different parts of the world and it was all made possible by a spark in the mind of some brilliant people. What these people possessed were powerful ideas that not only changed the world, it transfigured the way we think (Vargas, 2008).
Statement of the problem
In spite of having an apparently largest market share, the company wishes to increase their market. A number of customers have expressed lack of satisfaction with the services offered. This has created the need for an investigation the factors that affect customer service delivery in wireless services.
Approach and research questions
This research paper aims to identify specific qualities required by customers in using the wireless phone and create a plan for effective measurement of the same and drawing inferences logically from the data gathered. The research plan aims to draw from circumstantial measurements that point directly towards the parameters as there are no direct measures and/or measuring techniques that are available to measure the aforesaid parameters.
Data is to be gathered over protracted periods of time either from the past or into the future depending on the time frame available to the researcher. If a purely theoretical perspective is to be drawn, it is strongly recommended that measurements be done into the future, keeping the researcher as a control group leader and using data from non-control groups as well as the control groups and drawing a comparison. However, since the luxury of time is not available it is strongly recommended that data from the past be gathered and experiential and theoretical models be drawn as a result of this research.
One element of caution that needs to be maintained right through the research by the supervisor of the research is that personal biases of the supervisor must not impact recording of the observations during research. This is one key skill and behavior that essentially needs to be exhibited by the researcher during the course of the research. If this caution is not exercised, the entire effort would not yield appropriate results and may not give room for new learning in this field.
However, considering the fact that research concerning the market research is fairly lacking in detail, theories are also somewhat lacking. In order to develop theories, data will be collected from various books, journals and studies. Once the data has been compiled, I will then seek to add evidence to theories relating to the fact that certain factors influence the success of the wireless services (Edwards and Day, 2007; Gonring, 2005).
Objectives of market research
The aim of this paper is the establishment of possible marketing strategies to significantly improve Cingular market. In order to achieve the aim, there are several objectives to complete step by step:
- To analyze and compare the collected data in various time segment
- To gather and compare Cingular’s and its competitors’ marketing market share in each segment
- To conduct a survey related to customers’ opinion about Cingular
- To find out main barriers that stops Cingular from taking more market share
- To establish responsive and proactive marketing strategies
By consequence, the paper should be able to explain and help AT & T re-identify the marketing segmentations for the market; and to provide relevant strategies.
Research questions
This investigation will endeavor to answer the following questions:
- How do you find the services and the features of Cingular?
- What is currently the market share of Cingular in the market?
- Which wireless phone features that motivates customers to use the services of a company?
- Is the customer’s choice affected by his level of education?
Research design and procedures
This study will use the quantitative and comparative methodological approach to understand the relationship between the variables. The research design is a correlation design utilizing survey methodology and comparison of current scientific findings from scholars with different perspectives. It is important to note that this study cannot claim one variable caused or did not cause usage of Cingular, as other factors have not been examined to determine this fully and objectively.
Thus, this study can only examine whether Cingular product is better from others and draw conclusions based on the findings. Attributing cause and effect is however beyond the scope of this study’s size. Thereby, because the analyses are based on correlation and not true experimental design with randomization, cause and effect cannot be attributed without losing academic objectivity and hence jeopardizing the credibility of this study (Clow, 2009; Kotler and Keller, 2008.).
Survey
The instruments of this study will be a survey included with a self-designed questionnaire, which will be mailed to each participant at individual level and self-administered interviews with various people by taking appointments from them. The instrument of mail-based survey has been found the most economic and optimal way for research purposes. In this study, the information will be retrieved at individual levels. As this study is a cross-cultural research, the survey and interview questions was designed with similar style.
The protection of the human subjects, who will be involved in this study, will be of prime importance for us because any inappropriateness may cause serious dangers to their lives. In mail-based survey method of research, the contact with the subjects will not be direct, so they will not need much protection as in the case of interviews. However, a complete code of conduct will be included in this study for both interviewers and interviewee. The purpose of the research will be conveyed to every participant in order to avoid any lack of trust and confidence before starting research, which has been declared quite mandatory for any research proposal, either qualitative or quantitative. In addition, this study will also identify the basic needs to participants so as to restrain them from any risk or vulnerable situation. For this purpose, it is also intended to develop a consent form and get it signed by every participant before proceeding for interview. In addition, the information provided by every participant will be kept confidential. Every participant will be provided with a booklet of instructions in which ethical codes will be given to them, detailing the operating procedure of interviews. In other words, it will be tried to adhere with ethical norms of research studies so as to refrain from unethical actions and subsequently, deviant measures.
Sampling Plan
The sampling for this research is actually very simple. 402 participants from all the 51 states were sampled while a convenience sampling was done for the time period.
Sampling
There are two types of sampling, probability sampling and non-probability sampling. The probability sampling is further divided in to three types of sampling, which are Simple Random Sampling, Stratified Random Sampling, and Multi-Stage Sampling. The non-probability sampling is the most simple, yet it is the most unreliable form of sampling. The non-probability sampling is unreliable because of the fact that the samples are not based on the probability of their occurrence, rather on the convenience of the sampler.
The probability sampling is the more commonly accepted and implemented form of sampling. The first kind of sampling is the simple random sampling, this sampling is the as the name applies the simplest application of the random sampling techniques. This technique of sampling only takes in to account the basic requisite without considering the complications involved the sampling procedure due to the complicated demographic setup (Kalton, 1983).
The Stratified Random Sampling is designed to take in to account the complicate demographic setup, and the data is even more accurate however, the information in the Stratified Random Sampling takes more resources for compilation and as such, it is not a preferred means of gathering samples if the population is insignificant or simple in its arrangement and structure. The last form of sampling is the Multi-Stage Sampling, which may either employ the technique of Simple Random Sampling or Stratified Random Sampling; mostly Stratified random Sampling is used.
The Multi-Stage Sampling is used in places where the amount of data is large and the sample must contain a representation of the different samples within the population. The Multi-Stage Sampling is used in places where the data is too complicated or the population is too. So in order to ease the process, the sampling is broken down in stages to allow for a smooth and relatively easy development of the sampling data (Fowler, 2009).
Sampling frame refers to the names of module parts of society from which the sample is going to be obtained. Still in the same case, sampling method refers to the technique in which the sample is going to be collected. Let us consider a research on finding out the customer’s preference to Cingular phone. Stratified sampling is one of the methods used in sampling a population. This involves the act of isolating a vast population into subgroups with the by systematic sampling and taking a haphazard sample from each of the subgroups. Random sampling minimizes sampling error in a population. Hence, this augments the accuracy of any method of estimation used. The criteria for selection of stratification variables include a number of strata, stratifying variables, collapsed strata, equal allocation, small strata and highly skewed distributions (Boone and Kurtz, 1999).
Quantitative research methods can be used to gain access to a large sample size, which could not be accessed otherwise, by using qualitative data. Large sample sizes are the prime reason why such research methods are employed. Although the ability to handle large sample size is a strong point in itself, it provides various other benefits as well. Studies have shown that when the proportion of sample size increases with respect to the total population the chances of any errors or mistakes are reduced (Schultz, Tannenbaum and Lauterborn, 2004). Since the consumer service sector is targeting large samples, the quantitative research methods are fulfilling the dual purpose; one is to provide access to general public/ customers/ clients and the other is to reduce the chance of error; deviation of estimated results from real figures (Nash, 2000; Smith, 2007).
Overall demographics
The what, who, where and when questions in connection with the target individuals of the marketing approach that the company needs to adhere to specifically points out towards the more convenient way of addressing the marketing specifics that needs to be given careful care. To better specify these definitive aspects of marketing, this section shall define the said aspects according to the notable identification of the said elements mentioned (Laermer and Simmons, 2007). From the SPSS file
Gender
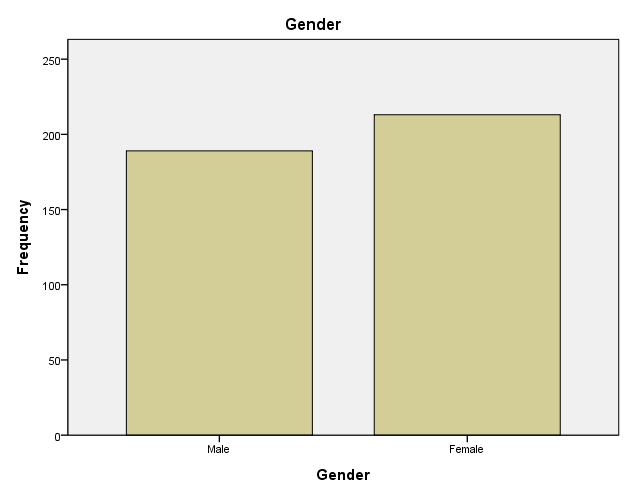
Among the people that were interviewed, female were the 213 while males were 189. This is shown by the graph and chart below
Age groups
The large percentile of target market were those who were born 1958-1968 who were 111 is followed closely by those born in 1969-1984 who were 101. Those born in 1950-157 were 90 and those of 1917 – 1949 were 100. The chart also shows the distribution of the target market.
Levels education
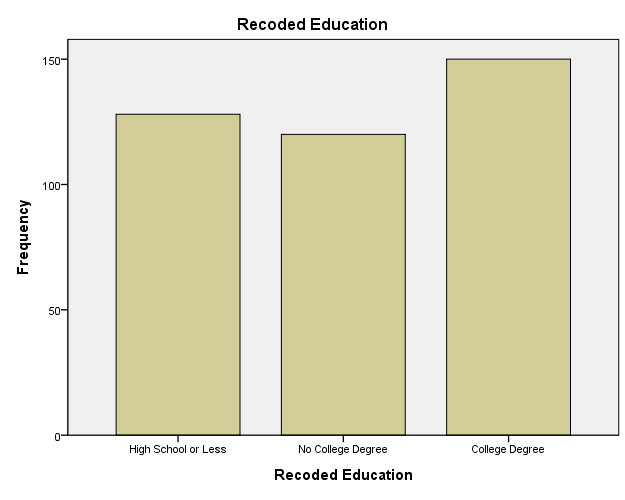
Those people with college degrees were 150 as shown by the chart below. Those people with no college degrees were 120 while those with high school or less levels of education were the 128 and 4 of them did not respond.
Household income
Exploration of the possible source of increase in market influence on the part of the business’ active correlation with the consumer-body it serves could actually manifest the indicative elements of development that the company should provide attention to especially in the aspect of marketing its phones. Household Income Had Greater Influence In The Consumption of Wireless Phone.
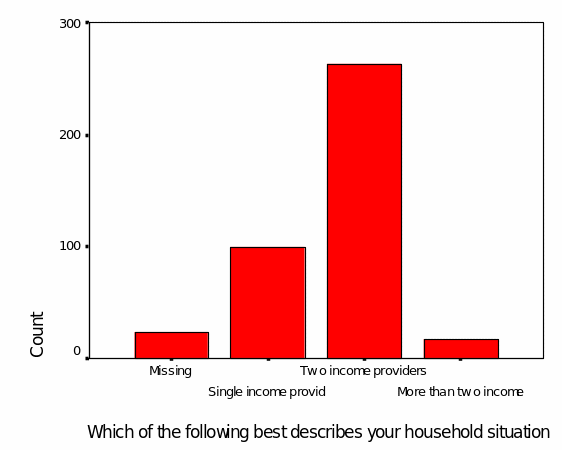
Those with to income prodders were more for the interview.
Comparative demographics
Levels of education
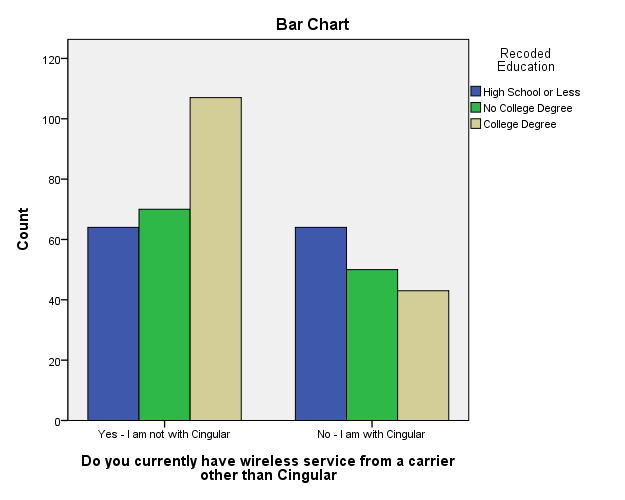
Among the respondents those with high school or less were 128. 64 of them had Cingular and other 64 had no Cingular phones. This means in this category 50% of the group were with Cingular. When it to comes to the category of those with no college degree 70 of the respondents were with other networks while 50 were with Cingular which represents 41.7% of those in the category. Those who had college degrees, 28.7% had Cingular services while 71.3% were with other networks. The chart below shows the comparative figures:
Gender
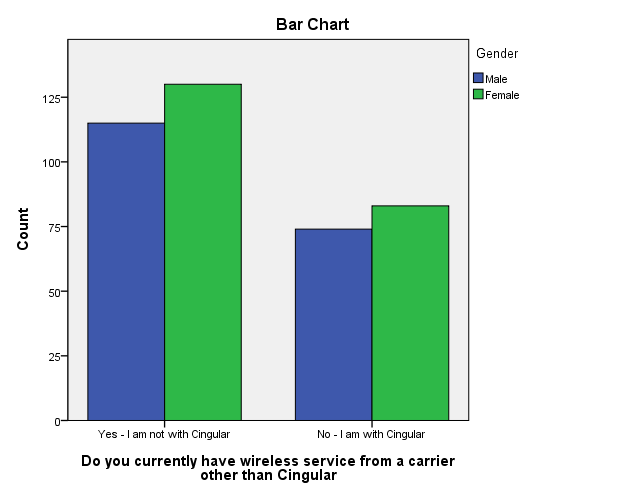
In terms of gender it was found out that female with wireless phone were 213 of which 83 were with Cingular and the other with other networks. The males who had wireless phones were 189 of which 74 of them had Cingular representing 39.2% the total respondents with wireless phone. The graph below shows the distribution of the respondent with wireless phones.
Cingular Performance
Cingular performance on specific attributes
From the T-test, you will find that the customers who had Cingular service were well served with the phone. Those who had the phone with the Cingular service had a standard deviation of 3.21 and they were 157 people with the mean of 6.86 for coverage needs. From the coverage that meets the customer’s needs, Cingular performed better than other phones. It had a standard error of 0.32 at 95 % confidence interval. When considering the ability of the consumer to receive or make calls from where he lives or at the point he is, Cingular also performed well than the other service providers. It had a mean of 6.7 while those with other wireless phones from other service providers were 5.79. The standard deviation was 3.31 for those with Cingular and 3.05 for those without.
In terms of quality, Cingular outshined other service providers by having a mean of 7.06 with a standard deviation of 2.89. Those without Cingular had a mean of 6.84 with a standard deviation of 2.57. The T-test in this case was -2.87 for those with assuming equal variances. Looking at a phone with error free billing statement, Cingular outshined other service providers because the mean and the standard deviation were 8.13 and 2.52, while those with wireless phones but not Cingular was 7.69 as a mean and 2.69 standard deviation.
Cingular performance on contracts, coverage and price
Considering the level of recorded education, you will find that Cingular coverage that meets the customer’s needs have F-test of 1.427 with a mean square of 14.58. While Cingular had favorable contract in comparison with the other service providers because it had a mean square of 7.414 and an F-test of 0.207. It appears that the whole was performing poorly in terms of contract requirements. When it comes to low prices, again Cingular appears to having low prices between the groups with an F-test of 0.625. Therefore, considering the recorded level of education, Cingular was voted as the best performer in terms of coverage that meets the customer needs, favorable contract and low prices.
When considering the recorded household situations you find that most of the household singled out Cingular services as the best in terms of favorable contract requirement and low prices. The F-test was 1.166 for Cingular with favorable contract requirement and 1.037 for low prices. While the number of respondents reduced from 395 to 377.
Comparative differences in Cingular performance
The paired sample statistics showed that Cingular coverage and favorable contracts have a correlation of 0.209 meaning that there is a positive relationship between coverage and contract requirements in the performance of the phone. -2.43 t-tests confirm this.
When considering coverage and low prices you will find a positive correlation of 0.254, meaning there is a positive relationship in these two factors in influencing the performance of this service. The t-test in this case was 3.154.
When considering favorable contracts you will find that it has correlation of 0.485 with a t-test of 7.517. This is a clear indication that there is a relationship between the variables and they influence the performance of the Cingular phone.
Contribution of attributes to general features
Coverage
From regression analysis, I find that when coverage is dependent variable while one is able to make calls and receive calls from where they leave or travel it has a t-value of 11.178. While if the customer gets few dropped calls has a t-value of 1.39. Voice quality contributes a great deal to the best attributes because it has a t-value 0.953. In total voice quality of cost is the best future that should be considered when looking at the coverage and the number of calls that are dropped. Whether the customer is able to receive calls from anywhere contributes less to the performance of singular.
Plans that meet needs
Considering favorable contract requirements, selection of phones that meet customers’ needs, provide high quality customer service and have low prices in terms of helping the customer meet their calling needs. We find that a feature of selection of various phones was rated the best with a t-value of 0.422 while the convenient of the store was also rated the best to the service delivery of the customer. Contract requirement and Cingular requirement were highly rated by the respondent. High quality customer service came third.
Factor analysis
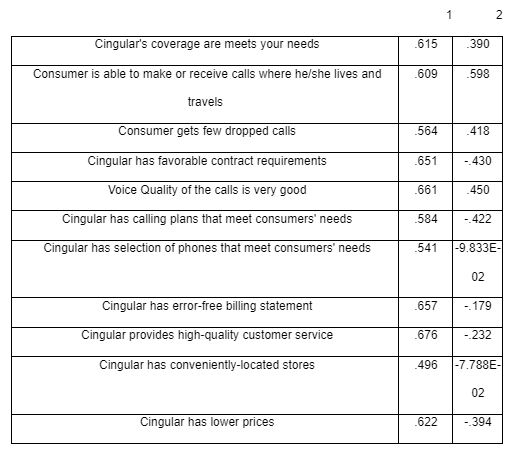
From factor analysis you will find that factor one had a variance of 37.157, factor two 13.705. In considering the correlation between the data, you will find that high quality customer service was rated the best because it had a component of 0.676. Voice quality was rated the second best with component one of 0.661, error free billing statement came third with a component of 0.657. Favorable contract requirement followed with the component of 0.51. Lower price, coverage area that meets the customer needs, the customer is able to make calls from anywhere and plans that meet customer needs had followed respectively. The table below shows the performance of each factor.
Conclusion
From the above analysis, Cingular performed well in terms of the coverage area, making and receiving calls from anywhere, getting free dropped calls, better voice qualities of the calls, had favorable contract requirements, availability of calling plans that meets the customer needs.
Recommendation
In order for AT & T to increase their market share, they should
- Improve on coverage area of the Cingular
- Improve on voice quality of Cingular
- Target those people with who have two persons in household with incomes.
- Increase marketing and make their wireless phones available in most places
Reference list
Boone, L. & Kurtz, D. 1999. Contemporary Marketing. New York: Harcourt Brace & Company.
Clow, K. (2009). Integrated Advertising, Promotion and Marketing Communications. New Delhi: Prentice Hall.
Edwards, H., & Day, D. 2007. Creating Passion Brands: How to Build Emotional Brand Connection with Customers. New York: Kogan Page.
Fowler, F.2009. Survey research methods. New York: Sage Publications.
Gonring, M. 2005. Global Megatrends Push IMC Concepts to Forefront of Strategic Business. Journal of Integrated Communications
Kalton, G. 1983. Introduction to survey sampling. New Jersey: Sage Publications.
Kotler, P., & Keller, K. 2008. Marketing Management. New Delhi: Prentice Hall.
Laermer, R., & Simmons, M. 2007. Punk Marketing. New York: Harper Collins.
Nash, E. 2000. Direct Marketing: Strategy, Planning, Execution. New York: McGraw-Hill.
Schultz, E, Tannenbaum, S., & Lauterborn R. 2004. The new marketing paradigm: integrated marketing communications. Sydney: NTC Business.
Smith, W. 2007. Innovative Marketing. New Jersey: Sumy.
Vargas, D. 2008. Integrated Marketing Communications, an Effective, Comprehensive Approach. New York: Business Ventures.