Inferential statistics are used to analyze a population depending on prevailing samples. In the medical fraternity, inferential statistics are more often used to compare different treatment groups. There are different methods of inferential statistics, and each is based on the principle that the test statistics are calculated in relation to a particular formula (Amrhein et al., 2019). Medically, they are essential in proposing explanations for various medical situations encountered. Depending on the extrapolations, a better conclusion is drawn regarding a medical problem. Also, they are used to formulate predictions on particular groups of patients that are under study.

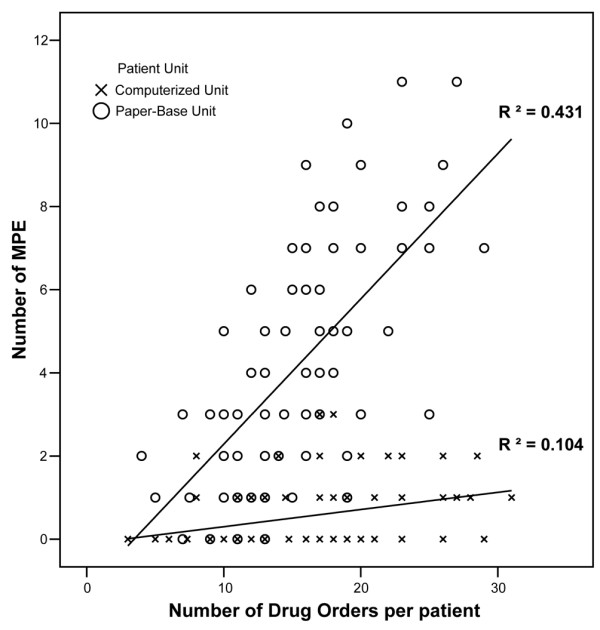
The scatter graph figure 1 above plots the rate and number of medication errors per the number of medications ordered per patient. It is used to express errors occurring in the health facilities, especially the intensive care unit, and it is among the leading causes of patient morbidity and mortality. It also leads to prolonged hospitalization periods which results in a raised hospital bill (Subbe et al., 2021). Both inferential and descriptive statistics have a role in data analysis and decision-making. In such research, inferential analysis is more preferred compared to the differential one. This is so because, in medical research the aim is to draw an ultimate conclusion that could aid in decision-making.
Descriptive statistics aims at analyzing large data using summary tables and charts. However, its analysis does not provide conclusions on the population under study. On the other hand, inferential statistics test a hypothesis and work to provide a piece of conclusive information on the population under study (Sarikaya & Gleicher, 2017). In conducting medical research where the aim is to draw specific conclusions on various treatment groups, inferential statistics is more appropriate and valuable compared to descriptive statistics.
References
Amrhein, V., Trafimow, D., & Greenland, S. (2019). Inferential statistics as descriptive statistics: There is no replication crisis if we don’t expect replication.The American Statistician, 73(sup1), 262-270. Web.
Subbe, C. P., Tellier, G., & Barach, P. (2021). Impact of electronic health records on predefined safety outcomes in patients admitted to hospital: a scoping review.BMJ open, 11(1), e047446. Web.
Sarikaya, A., & Gleicher, M. (2017). Scatterplots: Tasks, data, and designs. IEEE transactions on visualization and computer graphics, 24(1), 402-412. Web.