Introduction
SDLC relates to developments of projects in the information system. It ensures that the project meets all processes, functional, and user requirements (Roebuck 2). SDLC offers standardized and planned processes for all phases of the system development.
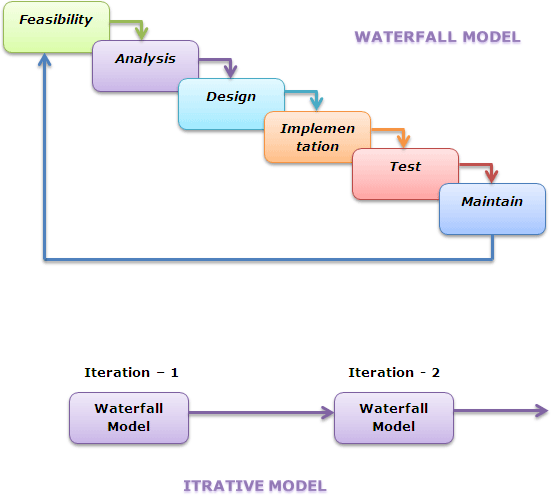
SDLC stages start from feasibility study to other aspects of planning, design, development, integration, and maintenance of completed projects. There are many SDLC models, which provide guidance for project development processes. These include the waterfall model, rapid application development, joint application development, and fountain model among others. In some cases, developers of SDLC models have combined some of the models in order to produce hybrid models (Post, Anderson 89).
It is necessary to note that various models have effective results in different applications. However, the most important factor that influences the project outcome is the planning and implementation process (Blanchard and Fabrycky 31). Generally, the SDLC model has six steps. The first step involves evaluation of the existing system. This is useful for identification of defects in the system. It may involve interviewing users and support teams.
The second step involves identification of system requirements. This stage seeks to address various defects in the system with specific suggestions for enhancing the system.
The third step is the design step. The developer must formulate plans for various aspects like operating systems, security features, hardware, physical development, and programming among others.
The fourth step accounts for the system development. Developers must install all required components. At the same time, users must also get training. The system must undergo testing, and developers must make any necessary adjustments at this point.
The fifth step involves the deployment of the system into use (testing). The new system can replace the old system or the developer can introduce the new system in phases.
The final step involves evaluation of the new system during operation. Maintenance is also necessary at this stage. The system also requires constant updates based on new developments.

Data Flow Diagram (DFD)
The DFD shows how systems process data in relation to inputs and outputs. The DFD is a graphical tool that highlights flow of data and stores data in its system. It shows how data undergo changes in a system. The DFD also has various symbols such as process flows, process symbols, data store and data flow symbols. The process symbol has entities to show the process number, locality, and process name (Shelly and Rosenblatt 332).
DFD highlights all stages that information must originate from, go to, and where the system shall store such information. However, DFD does not show timing process. In addition, it does not indicate whether the flow of information is parallel or sequential as most graphical representations show.
We have two categories of data flow diagrams, which are logical and physical. A logical DFD looks at how business and its processes run. It captures data needed and produced for each business process. Conversely, physical DFD focuses on implementation processes of a system.
Users can follow some standard steps in order to create DFDs. First, the DFD must have a process for data flow in and data flow out. Second, the must be data modification system. This involves transformation of incoming data in order to provide new forms of information as outputs. Third, every data flow must have a corresponding stored data. Fourth, every external entity must also have data flow in the system. Finally, data flow must have a corresponding process of transforming data (Ambler 263).
DFD has some advantages to users. For instance, it allows ease of understanding the system and sub-systems. A single process may also have several inputs. The user can also understand the current knowledge of the system. It has the ability to store information, and it can act as a part of documentation files. It is easy to understand data flow from the data flow diagram. Finally, it provides a summary of the flow information and enables users to trace errors with ease.
On the other hand, the DFD is complex and may present challenges to users with limited knowledge of the system. In addition, a process without any output is null. It needs constant monitoring for errors during input of data.

Entity Relationship Diagram (ERD)
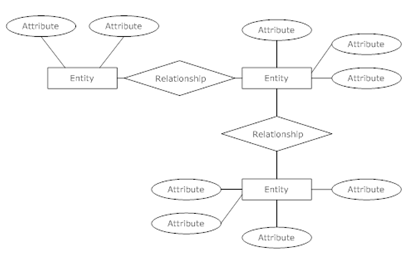
ERD is a technique used in data modeling by using graphical representations. It shows various entities and their relationships within a system of information (Thalheim 8).
ERD has three main areas. First, it has an entity that represents a user, an object, place, and a source of data. For instance, in a case where the entity is a customer, then we have to consider the customer’s information like address, orders, and other details (Bagui 32).
Second, the ERD also has relationship elements between entities. It shows interactions between entities of the system. For instance, when a customer places an order, the diagram shows the relationship between the customer and the order. A line or a shape may indicate relationships or interactions among entities. Some ERDs have verbs to define the relationship among entities.
Finally, cardinality shows how entities relate with reference to their numbers. We also have optional or mandatory entities. For instance, in cases where there are many numbers or no numbers to feed to the system.
Creating the ERD involves identification of entities, establishing relationships between entities, understanding the nature of entities’ relationships, and creating the ERD chart (Chen 9).

Microsoft SharePoint 2010
Microsoft SharePoint is a Web-based application platform from Microsoft (Microsoft Corporation 1). The application has been useful for document and content management. However, new versions have increased capabilities of the platform.
SharePoint has various components, which rely on other infrastructures. The application has capabilities to integrate with the Microsoft Office suite. It also enables non-technical users to have ease of use because of the design. It can manage documents, intranet portals, extranets, social networks, business intelligence, and collaboration among other functions. This application also has capabilities to integrate systems, processes, and workflow automation.
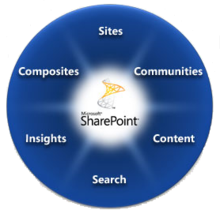
Microsoft SharePoint makes it easier for users to work as a team. Users can have a Web site in which they can “share information, manage documents, and publish reports using Microsoft SharePoint” (Microsoft Corporation 1). Some of the SharePoint capabilities include the following.
Site: this capability offers a single platform for all different aspects of a business Web site. Site allows sharing of documents, management of projects among users, and publication of information for various users.
Composite: this application provides tools and features for do-it-yourself users. It enables quick responses to urgent business needs.
Communities: SharePoint enables increased collaboration among users. It also provides a platform of managing all aspects of collaboration among users. It facilitates sharing of ideas among communities of users.
Content: this capability provides the ease of managing contents. Some of the features to enhance content management include “document types, retention policies, and automatic content sorting” (Microsoft Corporation 1). This allows users to work with Microsoft Office simultaneously.
Insights: this feature enables every user to gain access to information stored in the database, business platforms, and reports. It allows users to get information they need without difficulties for decision-making purposes.
Search: this feature enables users to locate documents easily. It entails a “combination of relevance, refinement, and social cues help people find the information and contacts they need to get their jobs done” (Microsoft Corporation 1).

Microsoft Access 2010
Microsoft Access is a relational database application. It enables users to “enter, manage, and run reports on large amounts of data” (GCF 1). The essential knowledge and skills needed to run Access database include “entering data into forms and tables, running queries to search data and producing meaningful reports” (GCF 1).
Microsoft Access database has many objects that enable users to interact with information. The database has forms for data entry, query features for searching stored data, report capabilities that generate analyzed data, and tables to store data.
Users apply several objects of Access at once when handling data. Microsoft Access features enable users to have ease of handling various objects and data simultaneously.
The four objects or features of Access 2010, tables, queries, forms, and reports, interact in various ways to enable users create a functional relational database.
Works Cited
Ambler, Scott W. The Object Primer 3rd ed. Cambridge: Cambridge University Press, 2004. Print.
Bagui, Sikha. Database Design Using Entity-Relationship Diagrams 2nd ed. New York: Auerbach Publications, 2011. Print.
Blanchard, Benjamin and Wolter Fabrycky. Systems engineering and analysis 4th ed. New Jersey: Prentice Hall, 2006. Print.
Chen, Peter. “The Entity-Relationship Model – Toward a Unified View of Data.” ACM Transactions on Database Systems, 1.1 (1976): 9-36. Print.
GCF. Access 2010. Web.
Microsoft Corporation. Microsoft SharePoint 2010. 2012. Web.
Post, Anderson. Management information systems: Solving business problems with information technology 4th ed. New York: McGraw-Hill, 2006. Print.
Roebuck, Kevin. Systems Development Life Cycle (Sdlc). New York: Emereo Pty Ltd, 2011. Print.
Shelly, Gary and Harry Rosenblatt. Systems Analysis and Design. Boston, MA: Cengage Learning, 2009. Print.
Thalheim, Bernhard. Entity-Relationship Modeling: Foundations of Database Technology. New York: Springer, 2000. Print.