The company is based in the United States. It was formed in 2006. The company operates in the internet industry. The initial public offering of the company was made on 7th November 2013 at $26 per share. The company offered seventy million shares during the initial public offering. The graph presented below shows the share prices of the company between 6th November 2013 and 23rd December 1999.
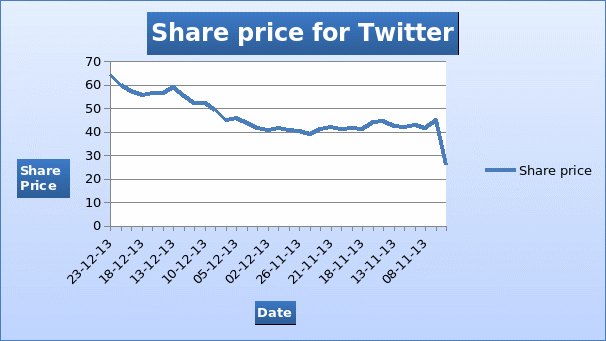
The graph shows that there was an increase in the share price of Twitter immediately after the initial public offering. Thereafter, there was no change in the share price of the company for some period followed by a significant increase. The graph presented below shows the returns of the shares.
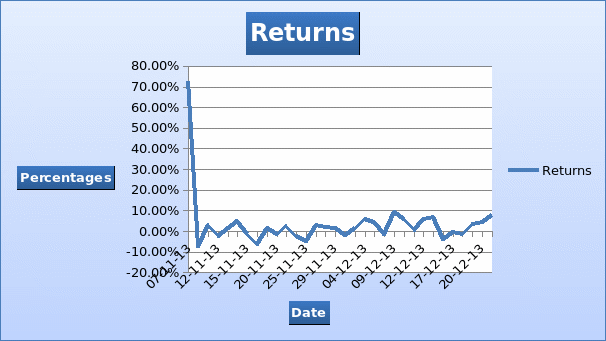
There was a significant increase in returns from the shares a day after the initial public offering. Therefore, the returns were stationary around the x-axis.
Google, Inc.
Google, Inc. is an American-based multinational company that was formed in 1998. The company operates in the internet, computer software, and telecommunication equipment industry. Initially, the company was privately owned. It went public on 19th August 2004. The company offered over nineteen million shares at a price of $85 per share. The graph presented below shows the share prices of the company between 19th August 2004 and 30th September 2006.
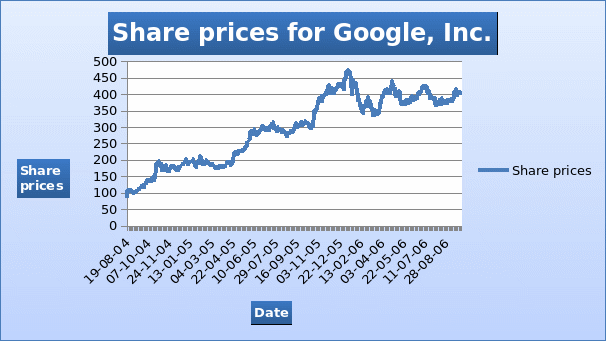
The graph shows that there was a continuous increase in the share price of the company two years after the initial public offer. It implies that the shareholders received a significant amount of return by investing in the shares of the company. The graph presented below shows the returns of the shares.
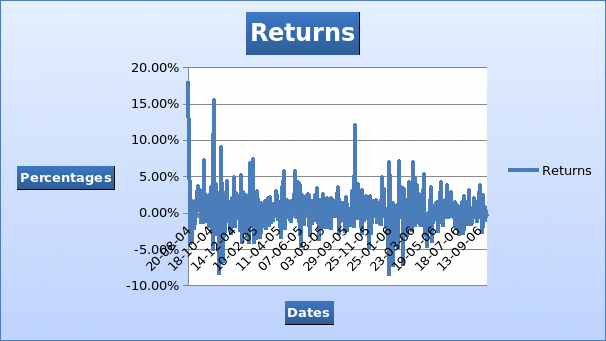
The returns of the shares for Google, Inc. were stationary during the period. The return oscillated around the x-axis. Further, it can be noted that there was a general increase in the share prices.
LinkedIn Corporation
The company was formed in December 2002. LinkedIn Corporation is based in America. The company trades on the New York Stock Exchange and it operates in the internet industry. The shares of the company were first traded on 19th May 2011 at a price of $45 per share. The graph presented below shows the share prices of the company between 19th May 2011 and 23rd December 2013.
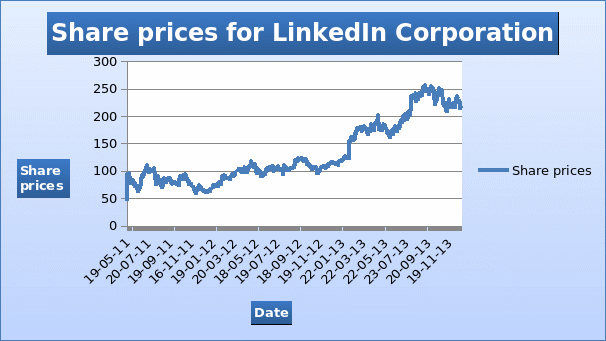
There was an increase in the share price of the company at the close of the first day of trading. Thereafter, the share price declined. It can be observed that there was a slow growth in the share prices between the date of the initial public offering and 2012. During the period, the shareholders received a small number of returns from their investment. In 2013, the company experienced a significant increase in share prices. The graph presented below shows the returns of the shares.
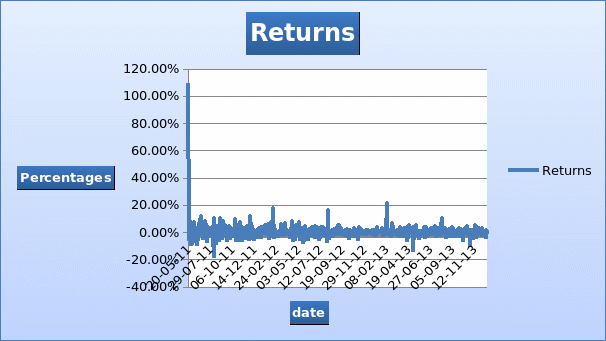
The returns of the shares for LinkedIn Corporation were stationary during the period. The return indicates a general increase in the share prices for the company.
Amazon.com, Inc.
The company is based in America. It was formed in 1994. The company trades on the internet and the online retailing industry. The initial public offering of the company was made on 18th May 1997 at $18 per share. The graph presented below shows the share prices of the company between 18th May 1997 and 30th June 1999.
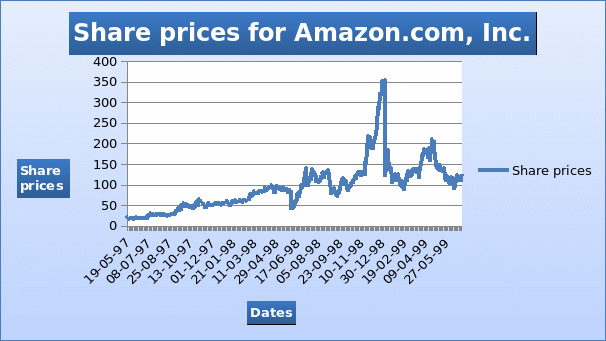
The graph indicates that the share price of the company remained fairly constant in the first two months of operations. Thereafter, the company reported a slow rate of increase in share prices. Two years after the initial public offering, the share price of the company had risen significantly to about $125. The graph presented below shows the returns of the shares.
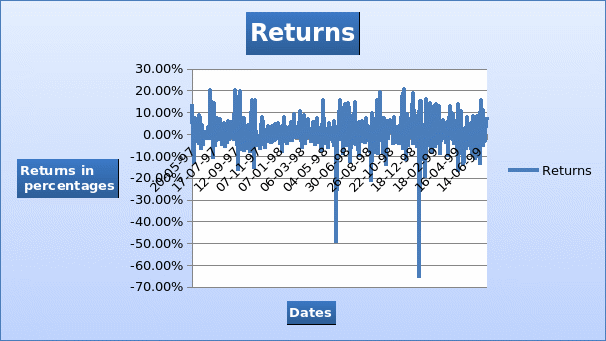
The graph above indicates that the returns of the company were stationary. There was no trend displayed in the returns.
Facebook, Inc.
Facebook, Inc. is an American-based company that was formed on 4th February 2004. The company operates in the internet industry. Initially, the company operated within the United States. It later expanded its operations to other parts of the world in 2005. Facebook, Inc. went public on 18th May 2012. The company raised about sixteen billion shares through the initial public offering. Each share was offered at $38. The graph presented below shows the share prices of the company between 18th May 2012 and 24th December 2013.
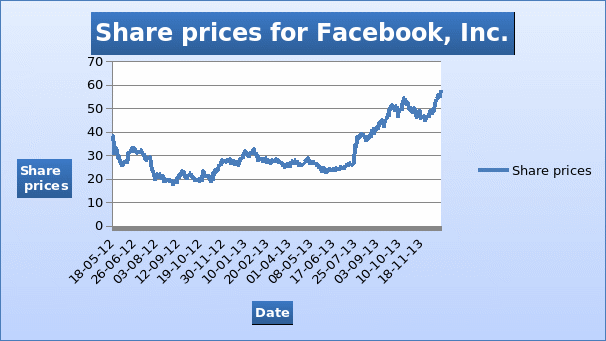
The graph above shows that the share prices of the company traded below the initial public offering price for one year and two months. The share prices thereafter started to increase in July 2013. This may be an indication that the share prices of the company at the initial public offering were overstated. The graph presented below shows the returns of the shares.
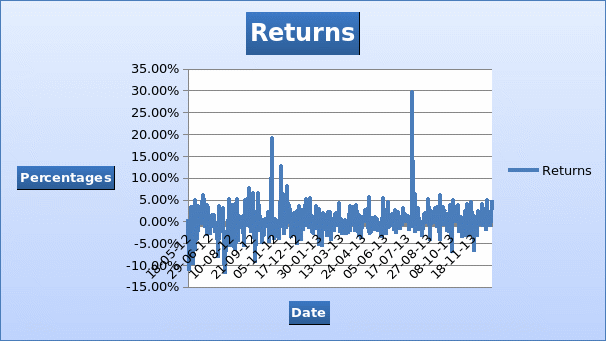
The graph above indicates that the returns of the company were stationary. There was no trend displayed in the returns.
Saudi Kayan Petrochemical Company
The company was formed on 11th June 2006. It went public on 23rd June 2007. The shares were offered at SR12 per share at the initial public offering. The graph presented below shows the share prices of the company between 23rd June 2007 and 24th December 2014.
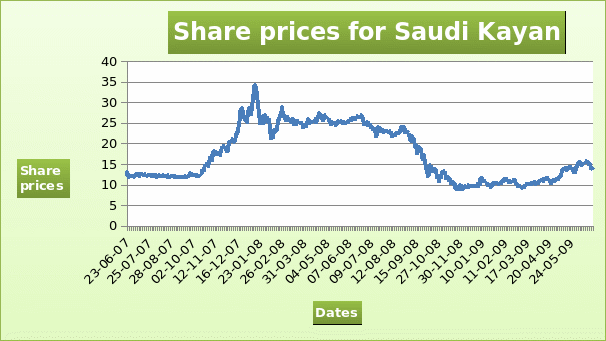
After the initial public offering, there was no change in the share price during the first four months of trading. The share prices increased and later declined in 2008 and 2009. The decline shows a reduction in the returns received by the shareholders. The graph presented below shows the returns of the shares.
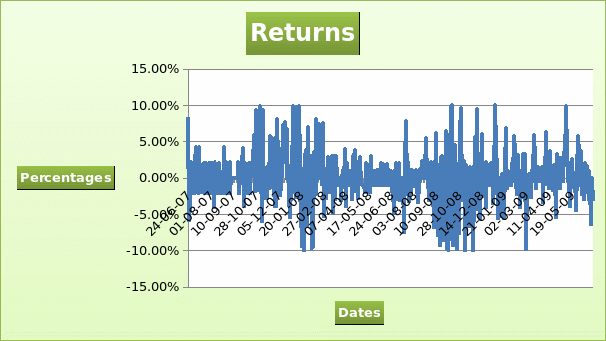
There was no trend displayed in the returns. There was no consistent increase or decrease in the returns.
Dar Al-Arkan Real Estate Development
The company deals with property development. It was formed in 1994. The company carried out its operations as a private limited liability company. It raised capital through private placements. It went public on 29th December 2007. Each share was offered at SR40. The graph presented below shows the share prices of the company between 29th December 2007 and 30th December 2009.
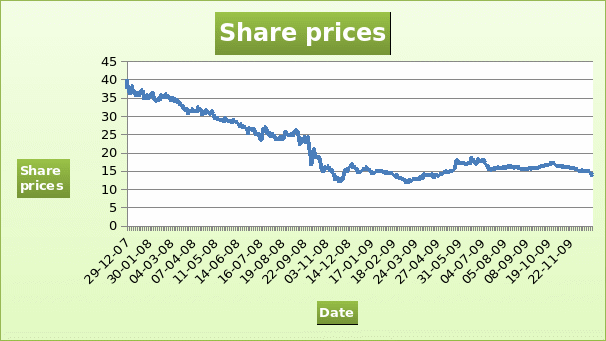
The shares of the company did not perform well after the initial public offering. It may be an indication that the share prices were overvalued. It may also indicate that the shareholders incurred losses after the initial public offering. The graph presented below shows the returns of the shares.
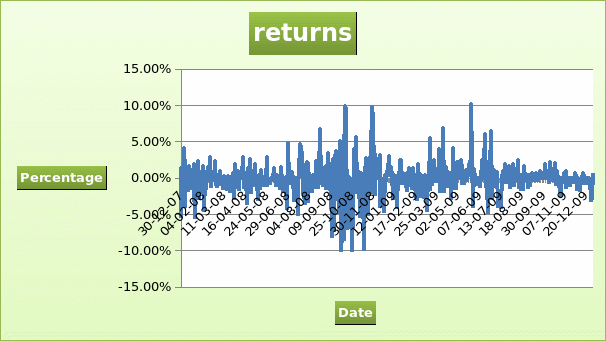
The graph shows that the movements of the share prices were below the x-axis. It implies that the share prices declined over the period.
Prince Al Waleed’s Kingdom Holding Company
The company deals with a variety of investments. The key interests are in entertainment, real estate, and banking. The company was formed in 1980 and it went public on 29th July 2007. Each share was offered at SR22.95 during the initial public offering. The graph presented below shows the share prices of the company between 29th July 2007 and 29th July 2009.
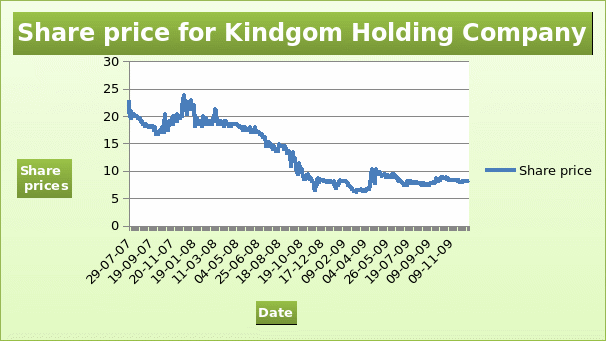
From the graph presented above, there was an overall decline in the share prices of the company after the initial public offering. This implies that the shareholders incurred losses in their investments. The graph presented below shows the returns of the shares.
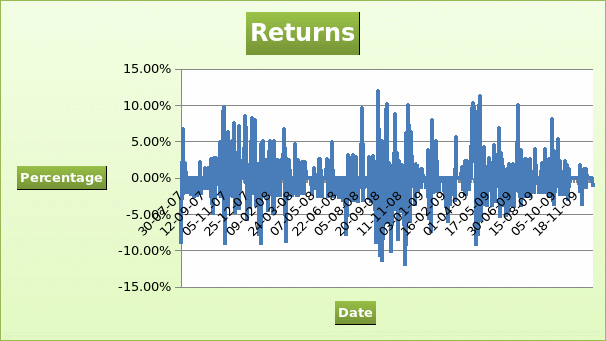
The graph shows that the returns on shares were negative.
Jabal Omar Development Company
The company went public on 1st December 2007. The graph presented below shows the share prices of the company between 1st December 2007 and 1st December 2009.
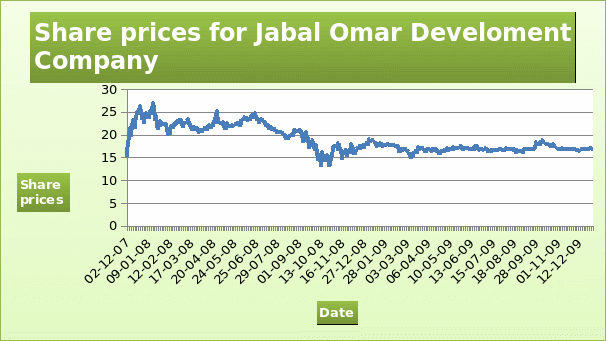
The share prices increased after the initial public offering. Thereafter, they declined. It indicates a loss to the shareholders. The graph presented below shows the returns of the shares.
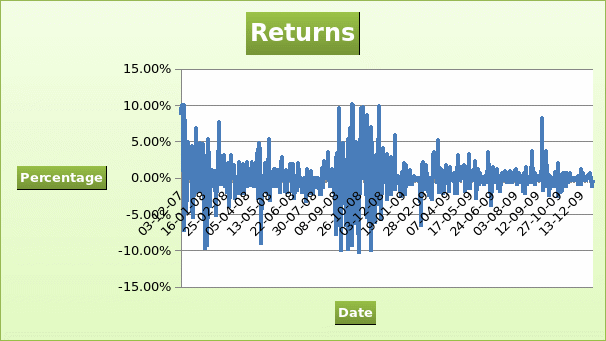
The graph shows that the investors received a minimal amount of return from their investment.
Mobile Telecommunication Company Saudi Arabia
The company went public in 2008. The graph presented below shows the share prices of the company between 22nd March 2008 and 22nd March 2010.
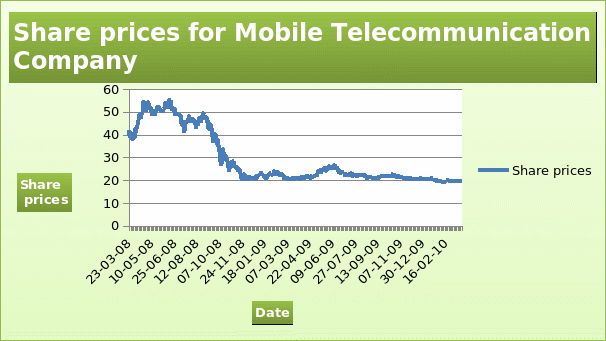
The graph presented below shows the returns of the shares.
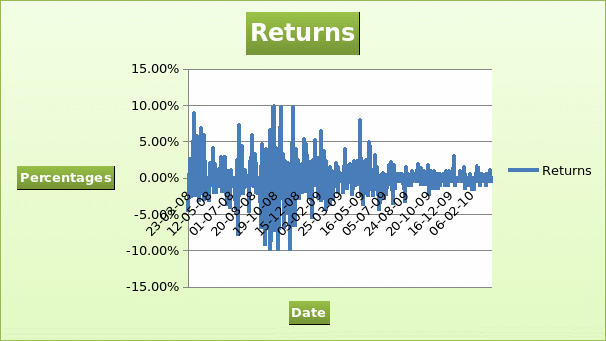
The graph for shares and returns show a decline in the value of shares after the initial public offering.
The above analysis indicates that the share prices increase after the initial public offering. The increase is followed by a decline in the share prices for a long period. The share prices for companies based in America increases gradually two years after the initial public offering while the share prices for companies based in Saudi Arabia declined within the first two years after the initial public offering.