Introduction
Kellogg: Company Background
- The company is a global leader in the production of cereals (MarketLine 2012).
- It is a multinational producer of snacks, breakfast cereals, crackers, and cookies.
- It has operations in more than 18 countries.
- The goods are distributed in approximately 180 nations around the globe.
Kellogg’s Marketing Project
- The marketing entails communication of the product’s value for the purposes of selling (Kerin 2012).
- It involves promotion and sale of products (Kotler & Keller 2012).
- Marketing actions include, among others, advertising and conducting market research.
- The duration of the marketing project is six months.
- It is divided into various phases.
The current paper is a proposed marketing project for Kellogg. The marketing plan is divided into different phases to enhance its effectiveness.


Kellogg’s Marketing Project
The project phases include:
- Initiation.
- Planning.
- Execution.
- Controlling.
- Closing.
The following activities will be undertaken to achieve the objectives of the marketing plan:
- Determining creative concept (a).
- Determining and securing communication media (b).
- Preparing the marketing message (c).
- Contacting communication media (d).
- Campaign execution (e).
- Assessing consumers’ response (f).
- Closing the marketing campaign (g).
According to Denscombe (2007), a project progresses through different stages. They include initiation, planning, execution, control, and closure. The tasks are given tags (IDs) for the purposes of entry into the Gantt chart. The IDs are also used to draw the critical path diagrams.

Gantt Chart
A Gantt chart is a visual representation of a given project’s schedule (Wilson 2003). The proposed marketing project will take a duration of 6 months.

Justification of Activities
Justification of the Activities Involved in the Gantt Chart
- The activities address all the phases of a project.
- They include planning, execution, and review.
- They involve the core elements associated with the marketing of Kellogg’s products.

Defining the Critical Path
The critical path can be drawn using the project’s network diagram.
The network diagram is as follows:

A network diagram illustrates the sequencing of activities involved in a given project (Wilson 2003). As such, it highlights the various tasks involved in the planning process.

Kellogg’s Marketing Project: Critical Path
There are two paths in the company’s project network diagram.
The paths include:
- Path 1: A-C-E-G Length = 1+1+3+1=5 months.
- Path 2: B-D-F-G Length = 2+2+1+1=4 months.
The longest route is A-C-E-G, which is 5 months. It is also the project’s critical path.
The critical path is the longest route through the network diagram (Hendrickson & Tung 2008). The number of paths in a given project vary depending on its duration and other dynamics.

Literature Review
Management Information Systems
Various types of information systems exist in business organisations. According to Laudon and Laudon (2009), they include:
- Transaction processing systems.
- Management information systems.
- Decision support systems.
- Executive information systems.
Management information systems provide the management team with the data needed in decision making.
Information processing requirements for a given organisation exist at 3 levels. The three are strategic, tactical, and operational levels (Adeoti-Adekeye1997).
Management information systems provide managers with the data required to effectively operate an organisation. The functions of MIS include extracting and summarising information from transaction processing systems. Other uses include the provision of scheduled and pre-specified reports (O’Brien 1999). The system allows managers to direct and monitor organisations. It provides accurate feedback from the stakeholders.

Proposed Information Processing Systems for Kellogg
Kellogg can implement various information processing systems at different organisational levels.
Some systems are crucial to the entity’s operational, tactical, and strategic management. According to Laudon and Laudon (2009), the systems include:
- Inventory management.
- Transaction processing.
- Office automation.
- Enterprise resource planning systems.
Inventory management systems help in stock taking and control (Laudon & Laudon 2009). On their part, transaction processing systems (TPS) assist in the collection and recording of routine transactions in the organisation (Cengiz, Ihsan & Emre 2011). Kellogg can utilise such a system to manage customer transactions. Examples of TPS models that the company can use include sales order entry, payroll, shipping, and employee record systems.
Office automation systems (OAS) support communication and production activities in the organisation. They involve automation of work flow and elimination of bottlenecks (Cengiz et al. 2011). The system serves all levels of the organisation.
Enterprise resource planning systems (ERP) enhance the flow of information among various internal business functions. In addition, it links these activities to external stakeholders (Cengiz et al. 2011). The model supports optimum utilisation of the resources available to the organisation.

Suggested Information Processing Systems
Enterprise applications suitable for Kellogg’s operations include:
- Knowledge management systems (KMS).
- Supply chain management systems (SCM).
- Customer relationship management systems (CRM).
The nature of the company’s operations calls for the extensive application of these systems.
Knowledge management systems help organisations to collect, record, organise, retrieve, and disseminate information (Cengiz et al. 2011). Kellogg can use the system to keep track of information on skills, practices, and procedures in the firm. The aim is to improve the company’s productivity.
Supply chain management systems improve the administration of delivery processes by synchronising the various links in the network (Cengiz et al. 2011). Kellogg can use the model to handle its supply chain. The system can address issues arising from suppliers of input materials and retailers of the company’s products.
Customer relationships management systems assist businesses to regulate their engagement with current and potential clients. The systems also help the organisation to handle its relationship with other business partners, such as marketing firms (Cengiz et al. 2011). Kellogg can adopt the strategy to develop a close relationship with customers. The aim is to improve customer service and increase profitability.

Financial Tools
Financial tools are used by companies to manage fiscal activities with the objective of attaining the desired returns on investments (Kimmel, Weygandt & Kieso 2013).
Monetary control is exercised through, among others, operating ratios and financial statements.
The fiscal tools evaluated in this study include:
- Discounted cash flow.
- Internal rates of return.

Discounted Cash Flow (DCF)
DCF is a valuation method used in estimating the attractiveness of investment opportunities (Kimmel et al. 2013).
The function is calculated as follows:

- CF=Cash Flow
- r=discounted rate (WACC)
- WAAC= Weighted Average Cost of Capital
DCF estimates total amount of cash that can be expected from an investment.
Under DCF, future cash flow projections are discounted. In most cases, the function uses weighted average costs of capital. The aim is to attain the present value of the investment (Kimmel et al. 2013). The current value is used to evaluate the potential of a given investment.
When the value of DCF exceeds the current investment cost, the investment opportunity can be regarded as feasible for the company. Basically, the function discounts or brings back the anticipated returns to their common ground, which is the present value.
There are two basic methods of computing DCF. The two are internal rate of return and the net present value methods (Kimmel et al. 2013).

Internal Rate of Return
IRR refers to the discounted rate used in capital budgeting.
It makes sure that net present value of all cash flows from given projects is equal to zero (Kimmel et al. 2013).
IRR is used in analysing alternative investments. It is mostly used on projects that have identical risks. It is not advisable to use it on fixed return undertakings.
However, the function has one major weakness. To this end, it assumes that cash flow discount rates remain the same during reinvestment.
A project with a high internal rate of return is more desirable than one with a low function. IRR can be used in the ranking of the prospective projects the firm is considering to invest in.

Financial Tools Recommendations for Kellogg
Kellogg’s has several financial tools at its disposal.
DCF and IRR can be used to project return on investments.
However, each of the two has its own shortcomings.
IRR has a complex formula. It is mostly determined on a trial and error basis.
Small changes in DCF can lead to significant alterations in its overall value (Kimmel et al. 2013).
DCF gives better results if terminal values in cash flows are used as opposed to infinite projections.

Methodology
Collection of Primary and Secondary Data for Kellogg
The success of Kellogg’s marketing project and customer responses should be evaluated.
There is need to use both primary and secondary sources of information.
Primary sources involve original materials from which raw or first-hand information is found (Denscombe 2007).
Primary data collection methods for Kellogg’s case include:
- Questionnaires.
- Observations.
- Surveys.

Primary and Secondary Data Collection for Kellogg
Sources of secondary information reflect data gathered from primary materials (Denscombe 2007).
The sources offer secondhand accounts.
Kellogg can obtain this data from the following:
- Newspaper articles.
- Campaign feedback analysis.
- Questionnaires and surveys analyses.

Justification of Data Collection Methods
The primary and secondary sources of data selected by Kellogg are relevant to the objectives of the project.
Marketing objectives include increased product awareness, brand promotion, and preference over competitors.
The selected methods will determine whether the objectives are realised or not (See Appendix I for questionnaire).

Findings and Analysis
Representative Data for Kellogg’s Decision Making
The objective of the survey is to enhance Kellogg’s brand penetration and recognition in 5 UK cities.
Survey involved sampling 2 retail outlets offering Kellogg’s products from each of the cities.

The representative data reflects findings from five cities in the UK. The cities were surveyed to determine the level of brand recognition and market penetration of Kellogg’s products. Two retail outlets were sampled from each city. They were reviewed to determine whether they offer Kellogg products or not.

Summary of Representative Values
Data from Kellogg’s survey:
- 1,1,2,2,2
Mean, mode, and median are the commonly used averages.
Mean is determined by dividing the number of values by their sum (Olive 2013).
- Sum of the data 1+1+2+2+2=8
- Number of values 5
- Mean 8/5=1.6
Mode refers to the value that is most recurring in the data (Hippel 2005).
Mode for Kellogg’s survey data:
- 1,1,2,2,2
- Mode: 2.
Median refers to the value in the middle when data is arranged in a numerical order (Hippel 2005).
Median for Kellogg’s data:
- 1,1,2,2,2.
- Median: 2.


Conclusions Drawn from Kellogg’s Data
Mean, mode, and median are measures of central tendency.
In cases where the data set has no extreme values, mean is used in the prediction of future results (Hippel 2005).
Kellogg’s data set has no outlying values.
A mean of 1.6 indicates higher chances of finding company products if more retail outlets are surveyed.
Mode and median values of 2 also indicate high prevalence of Kellogg’s products in the market.
Mean, mode, and median are regarded as measures of central tendency. The three measures indicate the point where data is clustering around or centered.

Analysing Kellogg’s Data through Measures of Dispersion
Measures of dispersion are used to quantitatively express the degree of variation for values in a given sample or population (Olive 2013).
The measures include standard deviation, range, average deviation, and interquartile range.

Measures of Dispersion for Kellogg
Standard Deviation
The function is the square root of the sample variance (Olive 2013).
It measures variability or spread of data.
It is calculated as the root mean square deviation of values from their arithmetic mean.

Standard Deviation
- Formula for standard deviation:
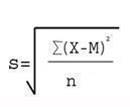
- Σ = Sum
- X = Individual score
- M = Mean of all scores
- N = Sample size (Number of scores in population) (Olive 2013)
- Kellogg’s standard deviation:
- M=1.6
- ∑(X-M)ⁿ = 1.2 n=2
- s= √ ∑(X-M)ⁿ∕N
- s= 0.24

The standard deviation of the population surveyed is 0.24.


Conclusions Drawn from Standard Deviation
The value of a measure of statistical dispersion is supposed to be zero in instances where all data is identical.
As the data becomes more diverse, the value of the measure increases.
As such, the value cannot be zero.
Standard deviation of 0.24 indicates little diversity in the population data.
In relation to Kellogg’s case, the value indicates increased likelihood of similar results from the sampled population.

Recommendations and Conclusions
Findings from the survey indicate high presence of Kellogg’s products in the sampled UK cities and retail outlets.
Measures of central tendency illustrate slight variations in data.
Measures of dispersion (standard deviation) highlight minimal diversity in sample values.
Both central tendency and dispersion measures give highly correlating results.
Future studies in relation to Kellogg’s products should focus on the company’s market share.
Market share can be analysed using volume of sales in sampled segments.
The measures of central tendency and dispersion are used to evaluate features and aspects of the sampled population. It helps in drawing conclusions. The measures used in this study indicate that data is clustering closely together. Consequently, it is apparent that results from sampled population are relatively similar. The value of the measure of dispersion used (standard deviation) indicates slight diversity. As such, one can conclude that the awareness of Kellogg’s product in the sampled markets is high.
Future studies on these products should try to determine the company’s market share since it is clear that the organisation is highly visible in the industry.

References
Adeoti-Adekeye, W 1997, ‘The importance of management information systems’, Library Review, vol. 46, no. 5, pp. 63-71.
Cengiz, K, Ihsan, K & Emre, C 2011, ‘Intelligence decision systems in enterprise information management’, Journal of Enterprise Information Management, vol. 24, no. 4, pp. 20-42.
Denscombe, M 2007, The good research guide for small-scale social research projects, Open University Press, New York.
Hendrickson, C & Tung, A 2008, Advanced scheduling techniques: project management for construction, Prentice Hall, New York.
Hippel, P 2005, ‘Mean, median, and skew: correcting a textbook rule’, Journal of Statistics Education, vol. 13, no. 2, pp. 4-21.
Kerin, R 2012, Marketing: the core, McGraw-Hill Ryerson, London.
Kimmel, P, Weygandt, J & Kieso, D 2013, Financial accounting: tools for business decision making, Prentice Hall, New York.
Kotler, P & Keller, L 2012, Marketing management , Pearson Education Limited, Boston, MA.
Laudon, K & Laudon, J 2009, Management information systems: managing the digital firm, Prentice Hall, New York.
MarketLine 2012, Kellogg Company SWOT analysis. Web.
O’Brien, J 1999, Management information systems: managing information technology in the internetworked enterprise, Irwin McGraw-Hill, Boston.
Olive, D 2013, Statistical theory and inference, Springer, New York.
Wilson, J 2003, ‘Gantt charts: a centenary appreciation’, European Journal of Operational Research, vol. 149, no. 2, pp.1-28.
Appendix
Kellogg’s Market Survey Questionnaire
- Business Name.
- Are you aware of Kellogg’s products?
- Yes.
- No.
- Do you offer any Kellogg’s brand in your store?
- Yes.
- No.
- If yes to three, how many Kellogg brands do you offer? (Indicate number)
- If no to three above, would you like to introduce Kellogg’s brand in your business?
- If you offer Kellogg’s brand products, what are your total annual returns from them?
- Less than $30,000.
- 30,000 – $39,999.
- $40,000 – $49,999.
- $50,000 – $59,999.
- $60,000 – $74,999.
- $75,000 – $99,999.
- $100,000 – $149,999.
- $150,000 – $249,999.
- $250,000 – $499,999.
- $500,000 – $999,999.
- 1 million or more.
- What is the estimated total net worth of this business? Less than
- $50,000.
- $100,000-$249,999.
- $500,000-$749,999.
- $1 million -$1.4 million.
- $2 million -$4.9 million.
- $10 million and over.
- $50,000-$99,999.
- $250,000-$499,999.
- $750,000-$999,999.
- $1.5 million -$1.9 million.
- $5 million -$9.9 million.
- Would you welcome another survey from us?
- Yes.
- No.
- If no, please give us your reasons.
- Thank you for your assistance and cooperation.