Introduction
Global warming is the new AIDS. Every educated and articulate opinion leader accepts the conventional wisdom that the unabated emission of greenhouse gases is slowly choking the earth, preventing heat from dissipating into space.
For perspective, the chief “greenhouse gas” is carbon dioxide (CO2), fourth in concentration among the major gases in the atmosphere. At one observatory in Hawaii, CO2 concentration is already reported to have exceeded 380 parts per million or about 0.04% of total gases.
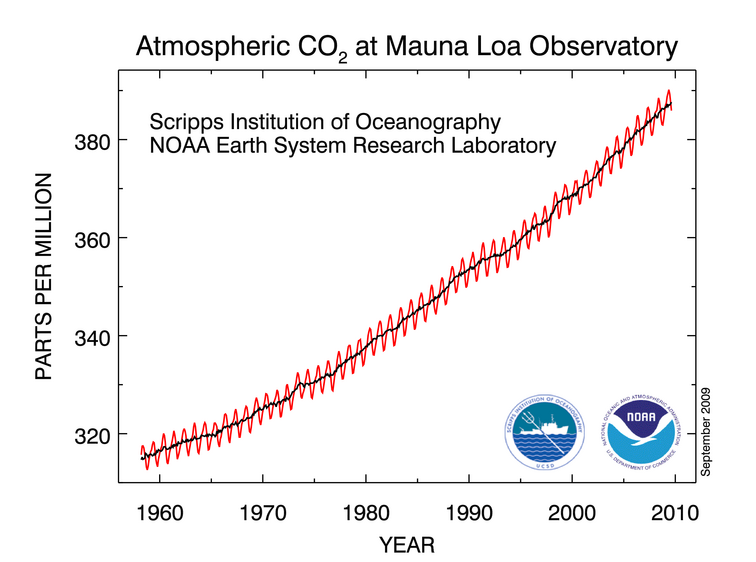
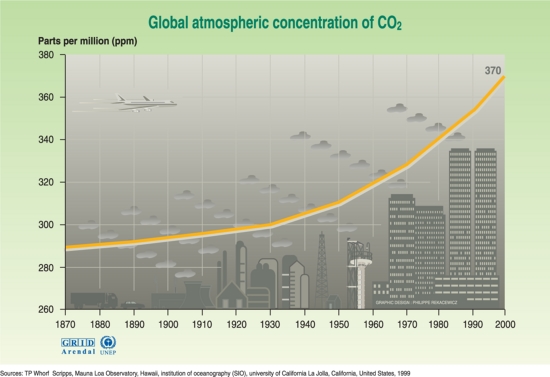
In the last century, there have been measurable increases in average temperature (about 0.3 to 0.6 Celsius) and a general rise in sea levels of from 2 to 10 inches (British Broadcasting Co. (BBC) News 1). Perhaps we can blame record-setting summer temperatures, the odd drought and freakish storms on greenhouse gases, perhaps not. What is certain is that growing populations need more electricity, buy fleets of cars, and consume more goods from factories that spew heat or carbon dioxide. Since the advent of the Industrial Revolution, mankind has used the earth as a giant trash bin, trusting that dirt would dissipate to somebody else’s backyard or that the atmosphere could absorb ceaseless plumes of carbon dioxide, methane, nitrous oxide, and chlorofluorocarbons (CFCs). By one estimate, global CO2 levels have climbed rapidly since the 1930s.
As Figure 3 (overleaf) reveals, the best available scientific models predict that global warming will accelerate in this century.
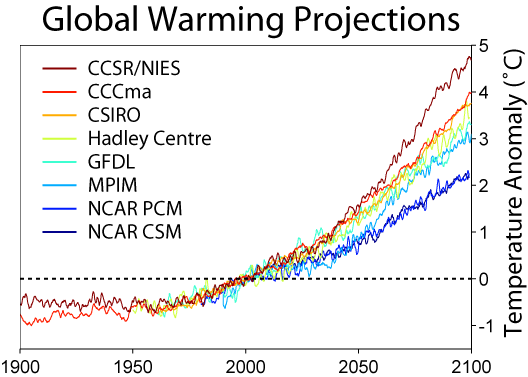
The above shows predicted climate model and in particular global warming under the Special Report on Emissions Scenarios A2 variant model, with global average temperatures in 2000 as baseline = 0.
Far from being an alarmist model, note that predicted values are for the end of the 21st century. Termed the “business as usual” scenario, SRES A2 assumes that the population has reached 15 billion (versus 4 billion today), the world is politically and socially diverse with little inclination for united action on climate change, and there is sustained economic growth but continuing inequities between rich and poor peoples. On the energy dependence front, the world situation in 2010 features high energy use and moderate dependency on fossil fuels, chiefly coal.
All in all, the IPCC forecasts a global temperature rise ranging from 1.4-5.8°C solely due to global warming.
As with AIDS and starvation, the man on the street is content to do his bit with buying cars that sip, not guzzle, gasoline. Switching to a preponderantly “green” lifestyle is just too much trouble. Meanwhile, our leaders bicker and rely on trading “carbon credits” or worse, pondering the imposition of “carbon taxes”. Could more draconian measures work? Must damping greenhouse gases remain a cost that manufacturers and car owners absorb now and into the future? What about the oil-producing countries of EMEA, blithely burning natural gas at the wellhead, writing billion-dollar economic development plans so more of their populations earn enough to own cars, underwriting more manufacturing, and most without the benefit of the native forests that are the natural carbon sinks of the planet?
Available information suggests Kuwait ranks among the worst polluters, on a per-capita basis. Happily, the technology exists to actively remedy the situation: carbon sequestration can concentrate carbon dioxide (and indeed any greenhouse gas) and employ it to prolong the economic life of the nation’s oil fields.
The Emissions Situation in Kuwait
On the face of it, data compiled by the Carbon Dioxide Information Center (1) for the United Nations Framework Convention on Climate Change (1) shows that Kuwait and virtually every other oil-exporting nation around the Gulf rank within the top half the worst sources of CO2 emissions.
Table 1 (Source: Carbon Dioxide Information Center).
Note that the top four spots are accounted for by the most populous nations, a factor that China and India use to deny responsibility for undue atmospheric emissions (Baehr 32). Among the Gulf states and exporters in Table 1 above, Iran ranks within the top nine CO2 emitters partly due to the fact that its population of 65.9 million looms large. Iraq, on the other hand, is thirty places lower with a population of 28.2 million. In contrast, Kuwait spews almost as much CO2 into the atmosphere with a population one-eleventh that of Iraq (CIA 1).
Framing the emissions picture in Kuwait on a per-capita basis (especially relative to wealth) and looking at the long-term trend (see Figure 4 overleaf) spotlights the opportunity for the nation to take greater responsibility. As America was the world’s worst polluter per capita principally because the growing wealth of the nation put millions of cars on the road, so Kuwait, Qatar, the UAE, and Bahrain are the worst CO2 polluters today, when adjusted for population base and per-capita income (Baehr 33).
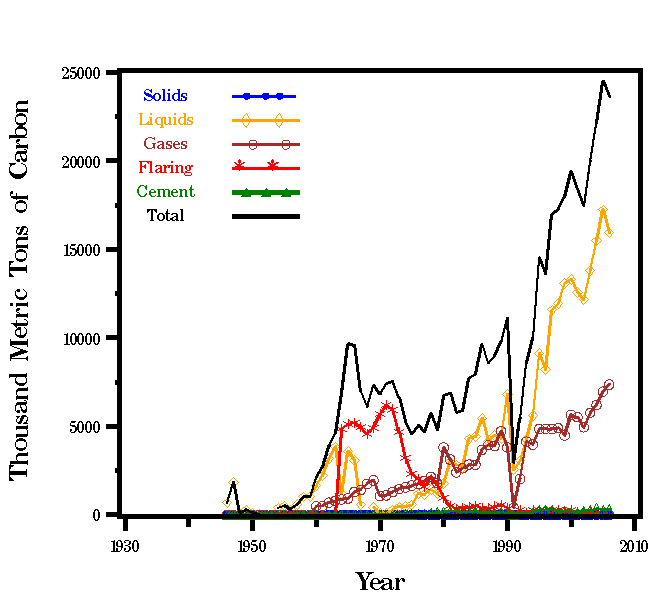
Figures 4 (above) and 5 (overleaf) reveal that both total pollutants and per-capita carbon emissions by Kuwaitis have trended continuously upward since the early 1980s, with the exception of the enforced hiatus in 1991 when Iraq invaded the country (Carbon Dioxide Information Center 1).
According to the World Economic Forum (12), the Persian Gulf nations have yet to come to grips with governance and climate change issues. Hidebound conservatism and complacency mean little is being done to address such issues as water supply, pollution levels, and climate change in the medium term.
Table 2 overleaf shows how Kuwait and three other Gulf nations are the worst polluters globally on a per-capita basis:
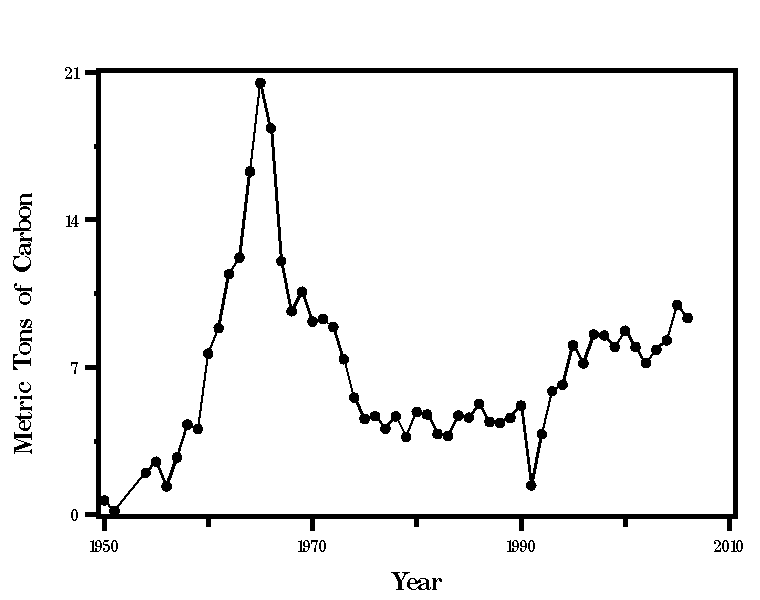
Table 2.
The Solution: Capture CO2 and Use It to Maximize Oil Well Productivity
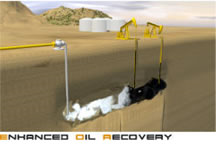
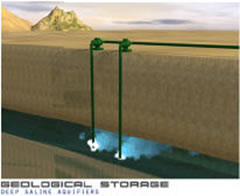
Fortunately, the petroleum drilling and field production field has a ready solution that the private sector can implement on its own and requires no policy initiatives or structural reforms on the part of the emirate. This is the secondary recovery method employing “gas lift” or carbon sequestration, pumping CO2 down test wells (Figure 6 overleaf) or purpose-drilled “injection wells” (Figure 7) and thus keeping it away from the atmosphere or employing the liquid and gaseous forms to get at the remaining two-thirds of reserves in aging oil wells when primary production has already gotten at the most accessible one-third of hydrocarbon volume.
Like another readily available substitute, plain water, CO2 at high pressure forces residual hydrocarbon deposits to “migrate” closer to the drill head and thus revive production for a little while longer. In fact, the advantage of using CO2 is that it is absorbed by petroleum, which makes the latter less viscous and easier to “lift” (Halmann and Steinberg, 1998). The gas can then be recovered on the surface and recycled for further use or sequestered in perpetuity. Schematics for this technique that obviously and greatly enhances oil producer revenue while sequestering CO2 from the atmosphere (or recycling that produced from “flaring off” natural gas) are shown below and on subsequent pages.
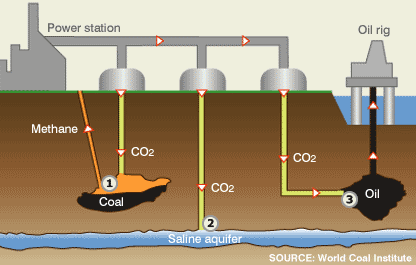
- CO2 pumped into idled coal fields displaces methane which can be used as fuel when it reaches the surface.
- CO2 can be pumped into and stored safely in saline aquifers, such as exist in Kuwait’s Burgan field. If the aquifer directly underlies the porous, oil bearing rock layers, then the effect is to help force secondary recovery deposits upward.
- CO2 pumped into oil fields helps maintain pressure, making extraction easier (BBC News, 2007)
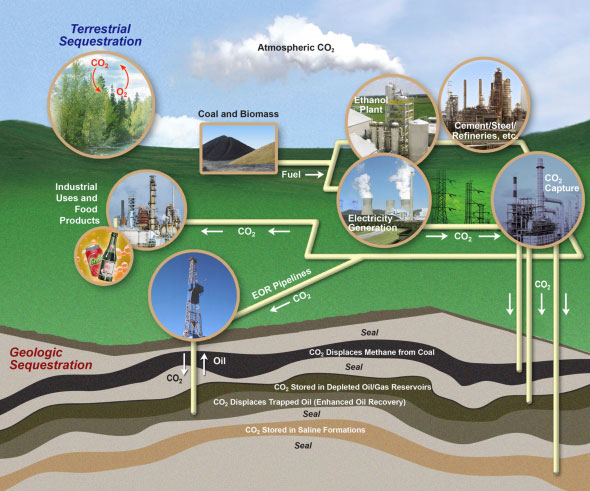
“Carbon management technologies are being advanced on a number of fronts. These include scrubbing and storing carbon in oil fields, saline aquifers and beneath the ocean floor in geology that offers both ample space and permanence. One study concludes that using carbon dioxide for enhanced oil recovery could lead to production of another 2 to 3 million barrels of oil per day in the United States alone.”
Why does oil field use of C02 even matter for an “oil-rich” nation like Kuwait? One answer is that sequestration is not possible in Kuwait since the nation has no depleted coal mines that could store CO2 gas in perpetuity. An alternative might be the underground limestone formations at the Al Khafji and Al Ratawi fields but the economics of forcing gas under pressure onto what are, after all, not cavities but layers of permeable rock remain questionable.
Why Kuwait Needs Secondary and Tertiary Extraction Methods
The answer that really impacts the bottom line for Kuwait partners like British Petroleum and political power within OPEC/OAPEC for Kuwait itself is the phenomenon known as “peak oil”, when the maximum national rate of petroleum production is reached and enters a remorselessly terminal decline. Unless new reserves are found or every means found to force residual oil in production wells close to drill heads and thence be extracted economically, Kuwait (and the world) will skid down the slippery slope called “depletion”.
Table 3.
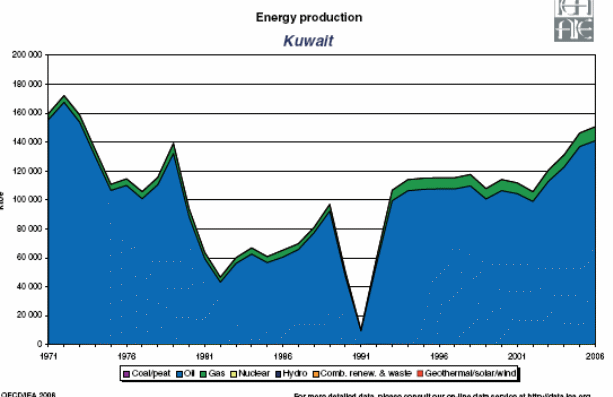
The International Energy Agency (IEA 1) reports current Kuwaiti crude oil production at 134 million tons annually as of 2006, equivalent to slightly more than 2.5 million barrels/day, and classifies this OPEC member as a “mature producer”. That is, peak oil has already been reached, no new reserves found, and national wellhead production has leveled off (but not yet declined). Note that, at last count, one-third of crude production went to “domestic supply” but a good portion of this was refined/cracked and also exported as LPG, gasoline, diesel, naphtha, AVGAS-grade kerosene, plain kerosene and residual fuel oil.
A historical review (Figure 10 overleaf) shows that Kuwaiti crude oil production peaked as far back as 1972, though the nation has recovered vigorously from the wanton destruction inflicted by Iraqis during the 1991 invasion. Total crude oil production rose remarkably from 2002 and continued to do so till 2006, the last annual assessment available from an impartial body like the IEA. If total energy production continues to climb and approach the 1972 peak, this will be because the government has encouraged the use of cleaner-burning natural gas.
Such production rates must be viewed against the background of claimed or proven reserves in order to assess the need for extraordinary measures to maximize extraction from production wells. As of 2001, Petroleum Intelligence Weekly reported from leaked government documents, the emirate had just 24 billion barrels in proven petroleum reserves. Even were every drop to be recoverable in a cost-effective manner, this means the lack of any new discoveries would wipe out Kuwait as an oil producer around the year 2027.
The feasibility of capturing and putting CO2 to use for secondary recovery is limited by the proportion of wells that are already in secondary production and to areas where an aquifer is not already acting as a natural upward impeller for crude deposits.
After the gigantic Ghawar reservoir, the largest oil field globally, the Burgan field in southeast Kuwait is the most sizeable, accounting for no less than 66% of the nation’s production. Burgan entered decline in November 2005 but gas injection may not be necessary since underground water in the Burgan sands already impel the crude upward. Where an aquifer is not present, as at Al Wara, it is the dissolved natural gas that, in seeking to expand or effervesce when the overhead pressure of extracted oil is relieved, that effectively impels the rest of the crude upward.
CO2 capture and gas lift is a possibility in Al Khafji, where some of the extracted natural gas is already used at present. This means the government would have incremental earnings from being able to sell the natural gas already employed for lifting (albeit at subsidized prices for domestic end-users) and help reduce atmospheric concentrations of CO2. Another way to release natural gas for commercial sale is to use sequestered CO2 directly in the production of ammonia and methanol instead of having to combine natural gas feedstock with steam to get CO2 and hydrogen.
Elsewhere, the government could mandate that trucked-in CO2 be used instead of the water that is currently used for secondary recovery (Ministry of Oil – Facts and Figures 2002 1).
Conclusion
Sooner or later, pragmatic solutions to greenhouse gas emissions must cover not only the most industrialized and populous newly-industrializing economies but those where, on a per-capita basis, governments have been neglectful about the profligate solid, gas and liquid emissions of their citizens. Where CO2 emissions are concerned, Kuwait, Qatar, Bahrain and the UAE are unquestionably among the worst offenders.
There is however, a happy confluence between the uses CO2 sequestration can be put to and the need for these oil-producing nations to maintain their political power within OPEC as high-volume producers. Carbon lift technologies can augment production, particularly in aging secondary and tertiary production wells, where no enhanced recovery technologies are currently in place or where Kuwait’s partners rely on aquifers and natural gas for non-induced lift. Since CO2 lift can account for millions of barrels of incremental daily production, the next step is to conduct a census of all such tertiary and secondary wells, estimate the volume of liquid CO2 that would be needed, and what the benefits would be in incremental raw crude production.
Works Cited
Baehr, Richard. “Carbon Emissions in the Middle East.” inFocus, 2009, Volume III: number 3, 30-33.
BBC News. 1998. Global Warming: The Facts. Web.
BBC News. 2007. Branson launches $25m climate bid. Web.
Carbon Dioxide Information Center. 2009. CO2 Emissions from Kuwait. Web.
Central Intelligence Agency. 2009. The World Factbook – Kuwait.
Halmann, Martin M. & Meyer Steinberg. 1998. Greenhouse Gas Carbon Dioxide Mitigation: Science and Technology. New York: CRC Press.
International Energy Agency. 2009. Kuwait. Web.
United Nations – United Nations Framework Convention on Climate Change. 2007. GHG Data from UNFCCC. Web.
World Economic Forum. 2007. The Arab World Competitiveness Report 2007. Web.