Application of learning curve
The essay aims at explaining the six sigma tools and techniques. Six-sigma is used in performing cost-benefit-analysis (CBA) and in quantification of important deliverables to a firm such as quality improvement, cycle time, quantity, cycle time and safety improvement. Six-sigma identifies obstacles and helps to go ahead in time, within budget limits and operational constraints (Learning curve strategy, 2009).
Learning curve
Whenever an activity is in progress for the first time, workers and operating procedures are untried, hence they use a lot of time and resources.
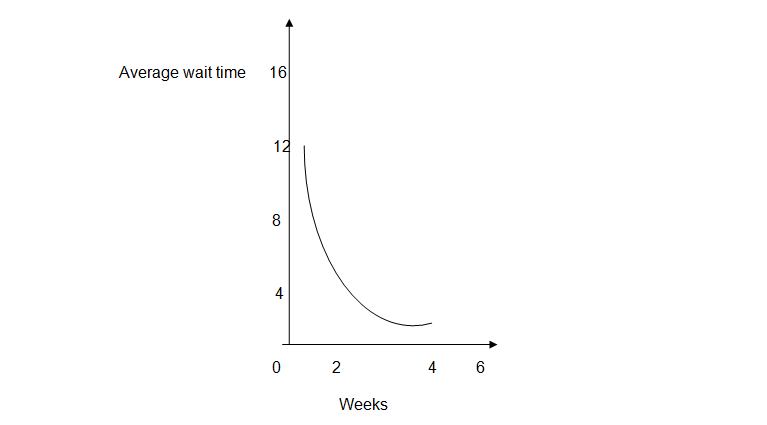
As the activity progresses, workers become familiar with the work and processes such that less time is required. This phenomenon is the learning curve concept, which is an essential concept in profitability and efficiency of the firm. The theory has three assumptions;
- The expected time of completing an activity decreases as the activity is repeated a number of times.
- Additional units produced leads to a corresponding decrease in percentage of improvement.
- Improvement rate is predictable over time.
“In general, there will be an increase in terms of performance such that the units produced doubles in a reduced time span after the implementation of the activity” (Learning curve strategy, 2009).
The simulation states the process used by Mario to open a Pizza store in Palm Springs in 1950. The store is inside a mall where they have a potential for profit and ability to attract customers. However, Mario is facing a challenge of unsatisfied customers. The situation was worse when clients left the Pizza store without purchasing the products due to long wait time. Mario should focus on customer retention, satisfaction, and getting new customers.
To get these changes, he needs to institute a change process that would reduce the total wait time per customer. The average wait time per customer is between seven to nine minutes and he needs to reduce this wait time. They have to provide first class service to their customers and balance their customer’s demands to get the business back to profitability.
Mario’s customers come in pairs or in fours. Optimization of peak hours, lunchtime and supper, is essential for the Pizza store. The currently peak time of 6-10:00 PM has a turnover of one table per fifty-three minutes from the progress report. The store has a capacity of 14 tables with four customers each.
The learning curve concept is of help to Mario since he has a small business. According to Learning curve strategy, “The process they undertake can use learning curve concept in a number of ways (Learning curve strategy, 2009)”.
“The concept of learning curve is from a historical observation whereby individuals who performing repetitive tasks show a considerable improvement in conduct of their job as the job are done repeatedly” (2009). In the simulation of Mario Pizza, the following performance data was available. I made a decision on whether or not to change the current serving cooks, staff and the amount of 2 person and 4 person tables to have the optimal service without cutting profits.

The table shows improvement in performance rate, increase in revenue and there is customer satisfaction which makes them willing to come and spend more. The profits improved from $1054 to $2081 by the end of the process. This shows the Pizza store took the right decisions. The right number of employees and the right combination of the number of tables makes the business activities easy and hence profitable.
Presently, Mario has the best business process. However, updating the process in line with changes in technology will serve customers better and efficiently. The reason why business exists is to make profits. Several changes made in the simulation process made it successful (Learning curve strategy, 2009).
The average time from analyzing the curve dropped from 11.67 to 5.53 minutes by the end of the month. Week eight’s slope is represented by (11.67 – 3.45)/ (8-0). This means that, the average waiting time reduced by 1.0272/11.67 = 0.0088 which is approximately 0.09. This means that the learning rate is 90%
Reference
Learning Curve Pricing Strategy . (2009, April 15). Web.