State report cards are important sources of information regarding students’ academic achievements in schools with the focus on changes in results in the concrete state, county, or school district. Such state report cards reflect the average academic scores of students regarding literacy, mathematics, and science among other areas (Siegel, Menon, Sinha, Promyod, & Wissehr, 2014). Much attention is also paid to presenting the data regarding the levels of teaching in the state, as well as enrollment and graduation rates (Jamgochian & Ketterlin-Geller, 2015; Paolini, 2015).
State report cards are valuable sources of data regarding the level and quality of education and students’ achievements in the concrete state and school in contrast to other states. The reason is in the fact that scores are presented in comparison with the state standards. Maryland State Report Card is selected for the assessment and analysis (Maryland State Department of Education, 2016). The purpose of this paper is to present the review of the state data regarding students’ scores, analyze the assessment data against the state benchmarks, discuss the state authorities’ strategies to improve results and provide recommendations for the improvement of the academic performance in Maryland.
Review of Maryland State Report Card
The data associated with the Maryland State Report Card is located on the special website where the information is divided into sections for the quick review of the required scores. The report presents the information on demographics in terms of data regarding teachers, absence, attendance, enrollment, and graduation rates, and on several types of assessments adopted in the state. The Partnership for Assessment of Readiness for College and Careers (PARCC) was adopted as the state assessment for skills in English and Mathematics in grades 3-8. The program was launched in 2015 (Maryland State Department of Education, 2016).
Students’ knowledge in Science is assessed with the help of the Maryland School Assessment (MSA), and high-school students’ knowledge is assessed with the High School Assessment (HSA) (Maryland State Department of Education, 2016). The knowledge and skills of students with disabilities are assessed with the help of the Alternate Maryland School Assessment.
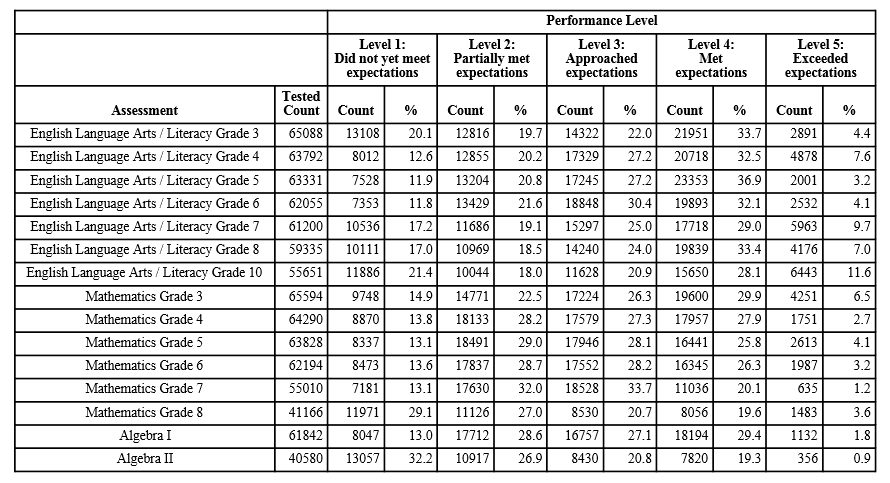
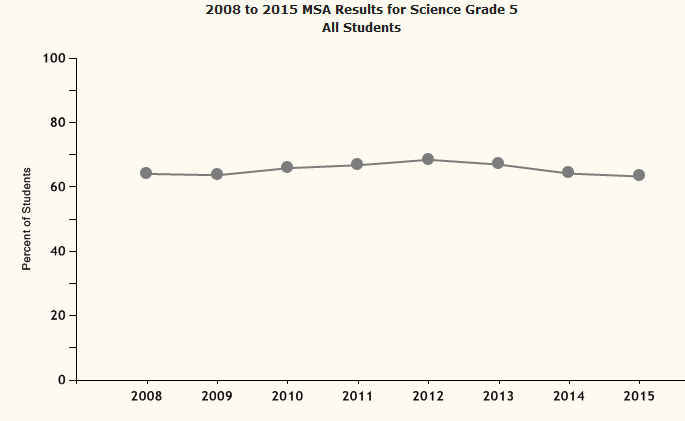
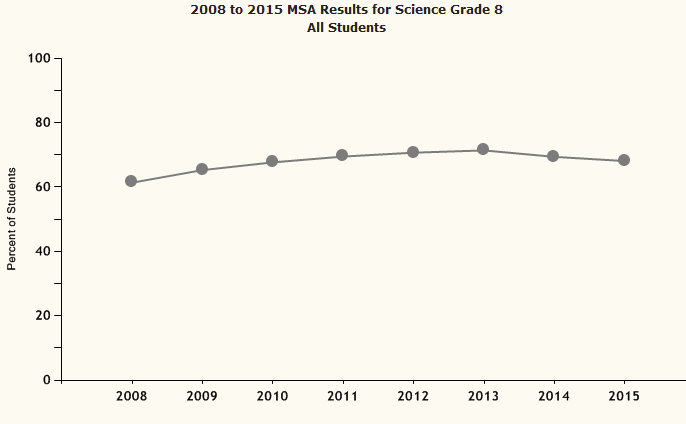
The report card indicates that, in 2015, the highest results for PARCC (“meet expectations” and “exceeded expectations”) were typical of students from grades 3-8 and grade 10 who were tested on English Language Arts and Literacy. The results regarding Mathematics were lower (Appendix A). The results of the MSA on Science indicate decreases in the scores of students from grades 5 and 8 in contrast to previous years by 1% (Appendix B).
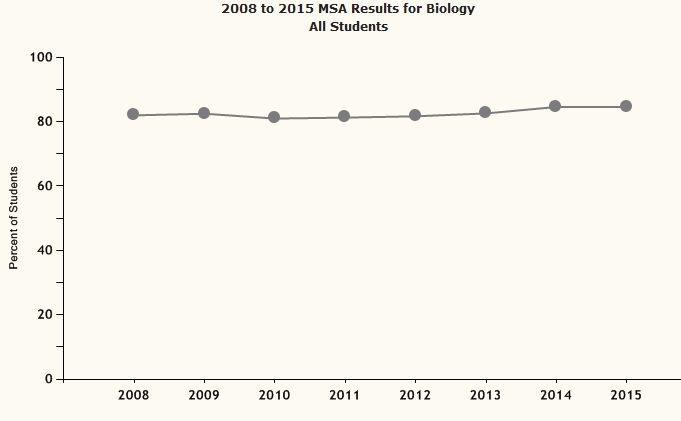
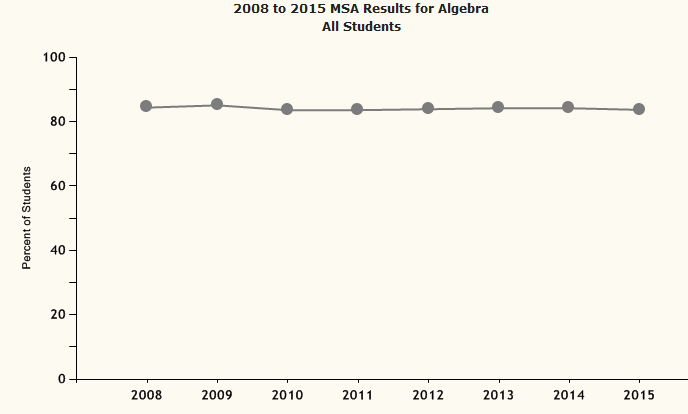
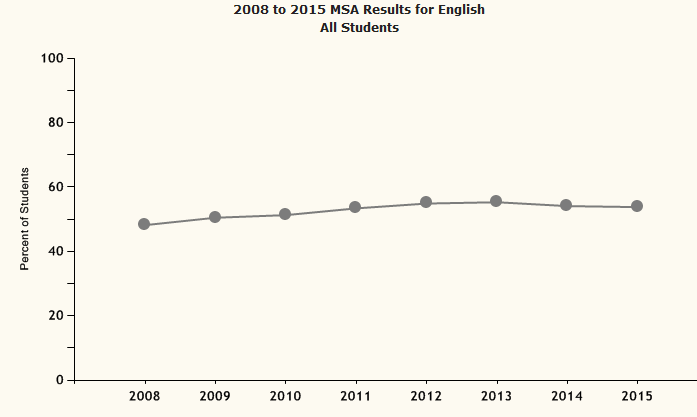
The results regarding Biology and Algebra are rather stable for several years (84.6 and 83.7 accordingly) (Appendix C). Those students who studied in high school from 2005 to 2015 or graduated in 2015 were assessed with the HSA tests. These assessments are presented in such fields as the English language, Algebra, Biology, and Government. The percentage of those students from grade 10 who passed all tests successfully is about 50%. The percentage of students from grade 11 is about 88%, and the percentage of students from grade 12 is 88.6% (Maryland State Department of Education, 2016). These scores and results are taken into account for the evaluation of the quality of education in Maryland and for determining the areas that need to be improved.
Analysis of Scores concerning Benchmarks
The Maryland Department of Education determined the benchmarks and scores that demonstrate the proficient and advanced level of understanding of the material for each grade and subject area. According to the objective-oriented approach, the analysis of the state report card is conducted with the focus on objectives set by evaluators and assessment developers (Evensen, Berge, Thygesen, Matre, & Solheim, 2016).
In this case, the analysis is conducted against the set benchmarks. For the analysis, the scores for the proficient level were selected as benchmarks because the percentages for the advanced level are comparably low, and they demonstrate the achievements that exceed the educators’ expectations (Afflerbach, 2016; O’Conner, Abedi, & Tung, 2012). For the fifth grade, the score for the proficient level in reading is 384, and 62.9% of students achieved this level in 2015.
For the eighth grade, the score for the proficient level in reading is 391, and 72.1% of students achieved this benchmark. The expected scores for mathematics in grades 5 and 8 are 392 and 407 accordingly. In 2015, these benchmarks were achieved by 68.3% and 78.2% accordingly (Maryland State Department of Education, 2016). The average score was decreased, but the state scores regarding reading and mathematics in grades 3-8 remained equal to or higher than the national average level.
Students’ achievements in high school should be discussed with the focus on scores in English, Algebra, and Biology. For English, the score for the proficient level is 396, and 53.8% of students achieved it in 2015. The results remain stable. For Algebra, the score is 412, and the percentage of achievement is 54.2%. The results remain stable. For Biology, the percentage is 61.2% with the targeted score in 400. The results decreased by 0.5% (Appendix C). The average state scores are higher than the national average in 1-12 points regarding different areas (Maryland State Department of Education, 2016). These results demonstrate that the overall level of education in Maryland schools is comparably high.
Maryland State Approaches to Improving Performance
According to the national rating of achievements, Maryland students are ranked as having B, and this result is extremely high. Following the results presented in Maryland State Card Report, the state schools provide high-class education to students, and the state holds the third position in the national rating (Maryland State Department of Education, 2016). These results allow speaking about successful attempts of state authorities to improve the students’ performance in schools.
The authorities admit the effectiveness of PARCC and MSA programs to assess the students’ achievements and accentuate the necessity of focusing not only on summative but also on formative tests and flexible approaches to implementing standardization in schools (Lissitz, Hou, & Slater, 2012).
While establishing standards, expectations regarding results become clearer, and teachers can work to address gaps in knowledge and skills directly. According to the accountability model, Maryland authorities provide teachers and students with rewards for increasing the scores (Emine & Cepni, 2014; Garcia, Lawton, & De Figueiredo, 2012). Referring to the objective-oriented approach, it is possible to state that Maryland schools work to achieve the set standards and objectives, and decreases in scores observed in comparison with the previous years are insignificant (Gordon, 2014; Hendrickson, 2012). On the contrary, the effective approach to teaching and user instructions and assessments in the middle and high schools allows continuous increases in the scores in comparison with the national levels.
Recommendations for Improving Performance
Even though Maryland results provided in the state report card indicate no obvious problems in students’ achievements, it is possible to provide recommendations regarding improving the performance to ensure Maryland can be ranked higher in comparison to other states. The first recommendation is to focus on the PARCC as a complementary assessment program in addition to existing MSA and HSA assessments as these approaches are not effective enough when they are used separately, and they cannot demonstrate the real picture. The second recommendation is to focus on those areas where students’ results are high, but they can be improved (Smith, Worsfold, Davies, Fisher, & McPhail, 2013).
The PARCC demonstrates that approaches to teaching mathematics in grades 3-8 and Algebra in high school can be improved, and students can be trained more effectively to complete standardized tests. The third recommendation is to focus more on educating students with disabilities and English learners to avoid exclusion in reporting the data and provide the full information on all students studied in grades 3-12.
Strategy for Communicating the Analysis Results
To communicate the results of the conducted analysis to educators in Maryland, including school district authorities and teachers, it is appropriate to use visual sources of information. To provide general information, it is important to use infographics with commentaries as the main tool (Plecki, Elfers, & Nakamura, 2012; Worth, 2014). To compare the state results with the national results, it is important to use charts and the PowerPoint Presentation. The general analysis of the assessed data should be presented as a brief report for specialists of the Maryland Department of Education.
Conclusion
Statistical reports on achievements and state report cards are effective tools to monitor the progress of students and their scores according to certain benchmarks. The analysis of these reports allows for providing recommendations for improving the performance. Decision-makers and school authorities receive the important information necessary to plan new programs, changes, and strategies. These data are important not only for administrations but also for teachers who can improve their instructions to achieve higher results. The teaching-learning process guided by standards and assessed according to reports can be discussed as effectively monitored to address identified problems and change approaches.
References
Afflerbach, P. (2016). Reading assessment. The Reading Teacher, 69(4), 413-419.
Emine, C. I. L., & Cepni, S. (2014). The association of intended and attained curriculum in science with program for International Students Assessment. International Education Studies, 7(9), 1-12.
Evensen, L. S., Berge, K. L., Thygesen, R., Matre, S., & Solheim, R. (2016). Standards as a tool for teaching and assessing cross-curricular writing. The Curriculum Journal, 14(1), 1-17.
Garcia, E. E., Lawton, K., & De Figueiredo, E. H. D. (2012). The education of English language learners in Arizona: A history of underachievement. Teachers College Record, 114(9), 1-18.
Gordon, E. W. (2014). From the assessment of education to the assessment for education: Policy and futures. Teachers College Record, 116(1), 110-122.
Hendrickson, K. A. (2012). Assessment in Finland: A scholarly reflection on one country’s use of formative, summative, and evaluative practices. Mid-Western Educational Researcher, 25(1), 33-43.
Jamgochian, E. M., & Ketterlin-Geller, L. R. (2015). The 2% transition supporting access to state assessments for students with disabilities. Teaching Exceptional Children, 48(1), 28-35.
Lissitz, R. W., Hou, X., & Slater, S. C. (2012). The contribution of constructed response items to large scale assessment: Measuring and understanding their impact. Association of Test Publishers, 13(3), 12-23.
Maryland State Department of Education. (2016). 2015 Maryland Report Card. Web.
O’Conner, R., Abedi, J., & Tung, S. (2012). A descriptive analysis of enrollment and achievement among limited English proficient students in Maryland. Regional Educational Laboratory Mid-Atlantic, 128(1), 1-45.
Paolini, A. (2015). Enhancing teaching effectiveness and student learning outcomes. The Journal of Effective Teaching, 20(1), 1-32.
Plecki, M. L., Elfers, A. M., & Nakamura, Y. (2012). Using evidence for teacher education program improvement and accountability: An illustrative case of the role of value-added measures. Journal of Teacher Education, 63(5), 318-334.
Siegel, M. A., Menon, D., Sinha, S., Promyod, N., & Wissehr, C. (2014). Equitable written assessments for English language learners: How scaffolding helps. Journal of Science Teacher Education, 25(6), 681-708.
Smith, C. D., Worsfold, K., Davies, L., Fisher, R., & McPhail, R. (2013). Assessment literacy and student learning: The case for explicitly developing students ‘assessment literacy’. Assessment & Evaluation in Higher Education, 38(1), 44-60.
Worth, N. (2014). Student-focused assessment criteria: Thinking through best practice. Journal of Geography in Higher Education, 38(3), 361-372.
Appendix A
Appendix B
Appendix C
