Introduction
The cost of education continues to surge more rapidly than inflation and high rates of education achievements are seen in institutions or states with higher education expenditures. In investigating the above-stated claim, the current problem seeks to estimate the causal effect of education spending on student academic achimenes. As noted by Nicoletti and Rabe (2017), increasing education expenditure per student improves academic achievement. This is affirmed by Hoisington et al. (2018), who believe that low academic performance is registered in economically disadvantaged regions because they spend less on education per student. Given the problem at hand has a theoretical backup, we intend to use the data provided in Table 1, copied to Spreadsheet, to establish the relationship between education expenditure per student and graduation rates in the US. Making a scatter plot of the data using demos is the beginning point of solving real-world problems using linear regression techniques, summarized by Equation 1.

Reasonable Answer
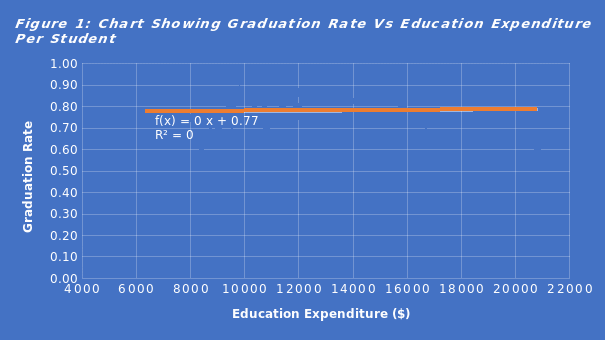
The response to the stated problem is obtained from the constructed scatter plot diagram in Figure 1. It allowed me to visualize how expenditure on education per student impacts the graduation rate. From this chart, the correlation coefficient between the graduation rate and education spending per student is 0.0316. Seemingly, the correlation is less than 0.5, indicating the existence of a weak positive relationship between graduation rate and education expenditure per student. Simply put, the amount spent on every student has a statistically insignificant influence on student graduation rates. The linear regression model obtained from the current analysis is expressed in Equation 2.
Solve and Communicate
The scatter plot in Figure 1, played a pivotal role in solving the problem. By considering graduation rates as a dependent variable and expenditure per student as an independent variable, I drew a scatter plot in an Excel spreadsheet and fitted a linear regression line. Excel commands were further applied to display the linear regression equation and the square of the correlation coefficient (![]() ), as shown in Figure 1. To find R, I obtained the square root of (
), as shown in Figure 1. To find R, I obtained the square root of (![]() ), say
), say ![]() . In other words,
. In other words, ![]() (rounded to 4 decimal places). Since the linear regression line fitted rises from the left to the right side, the coefficient is positive. The positivity of the correlation coefficient indicates the existence of a positive relationship. The regression model is copied from the chart in Figure 1.
(rounded to 4 decimal places). Since the linear regression line fitted rises from the left to the right side, the coefficient is positive. The positivity of the correlation coefficient indicates the existence of a positive relationship. The regression model is copied from the chart in Figure 1.

Conclusion
In conclusion, scatter plots play a pivotal role in solving real-world problems that require the application of regression techniques, including linear, exponential, logarithmic, and polynomials. In the current case, the scatter plot was the first stage that aided the fitting of the linear regression line. After a linear regression line was obtained, the analyst proceeded to display a linear regression model, alongside the square of the correlation coefficient, which further yielded the coefficient per se. The weak positive relationship shows a lack of statistically significant connection between expenditure per student and education graduation. Although graduation is an element of school achievement, it does not relate positively to increased expenditure on education per child. Ideally, it is wise to spend less on a child to make them crave for satisfying lives by aiming higher grades in school. Children who are enjoying satisfying lives harness less effort in academics, hence, attain low grades. Although it has been established from theories that increasing education expenditure increases students’ academic achievement, the present case displays a weaker link.
References
Hoisington, S., Slate, J. R., Martinez-Garcia, C., & Barnes, W. (2018). Differences in academic achievement as a function of instructional expenditure ratio for students in poverty. Athens Journal of Education, 5(2), 111-130.
Nicoletti, C., & Rabe, B. (2017). The effect of school spending on student achievement: Addressing biases in value‐added models. Journal of the Royal Statistical Society: Series A (Statistics in Society), 181(2), 487-515.