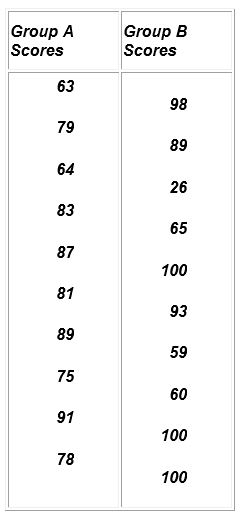
Case Assignment One
Mean of Group A= (63+79+64+83+87+81+89+75+91+78)/10 =79
Mean of Group B= (98+89+26+65+100+93+59+60+100+100)/10 =79
Median of Group A= 80
Median of Group B=91
Mode of Group A= No mode
Mode of Group B= 100
Standard deviation of Group A= 8.23
Standard deviation of Group B=25.27
Case analysis
The reason for calculating the measures of central tendency and dispersion is to be able to make an appropriate choice of the two groups of workers. The aim is to get a group with higher manual dexterity so that there is less significant breakage in the inventory. From the calculated means, it is not able to determine the best group as all have a mean of 79. Therefore the mean is not the appropriate measure of central tendency to use in this data (Camilli, 2009, p.2). The model, on the other hand, depicts that group B is the best choice as most people in the group have the manual dexterity of 100. This is an indication that there will be less breakage of the inventory as most workers will be of high manual dexterity. From the calculated medians, the best option will be group B as more than fifty percent of the workers have a higher manual dexterity as compared to group A. The standard deviation as a measure of dispersion in this set of data shows that group B deviates from the mean by 25.27 while group a deviates from the mean by 8.23. This indicates that the workers of group A have a manual dexterity close to 79 while in group B most of the workers have a manual dexterity far from 79 on the higher side hence it is the best choice between the two(Holland, 2006, p.3). It can be concluded that group B is the best option from the above analysis as it is made up of workers who have a higher manual dexterity hence there will be less breakage of inventory.
Case assignment Two
Mean of the data= (3+5+2+4+3+5+5+4+3+5)/10
=3.9
Median=(2,3,3,3,4,4,5,5,5,5)
= (4+4)/2
=4
Mode=5
Are these numbers higher or lower than you would have expected?
The mean is lower than I expected since most of the times I spent more time in personal study than that depicted by the average.
The median was expected since more in more than half the ten days I took four or more hours in personal study.
The mode was also expected since in most of the days I studied for around five hours per day.
Which of these measures of central tendency do you think most accurately describes the lifestyle variable you are looking at?
In my opinion the mode and the median depict my lifestyle. This is because in most of the cases took about four to five hours on persona study (Smith, 2009, p.1). The mean does not effectively represent my lifestyle as it involves the whole set of data including the times I took less time to study for example the time I took two hours.
Reference List
Camilli, G. (2009). Quantitative methods. Web.
Holland, J. (2006). Data Analysis in the Anthropological Sciences. Web.
Smith, M. (2009). Measures of Central Tendency and Dispersion. Web.