Introduction
The growth and development of organisms are products not only of the internal organization of life but also of the influence of external forces, including abiotic and biotic factors. For example, the growth intensity of microorganisms directly depends on the acidity of the environment in which they develop (Ratzke and Gore 6). It is known that there are at least three categories of unicellular organisms depending on their metabolic adaptation to the pH of the environment: acidophiles, neutrophiles, and alkaliphiles.
In this case, a mismatch between the metabolic orientation of the microorganism and the nature of the environment leads either to inhibition of activity or to death. The above principle is used in this laboratory work, the aim of which is to evaluate the effect of the pH of the medium on the growth of microorganisms. More specifically, samples of two bacterial cultures — Gram-positive and Gram-negative ones — were cultured on three different broth with pH equal to 3, 7, and 9. Both E. coli bacterial lines were shown to be classified as typical neutrophils, whereas S. epidermidis is regarded as an intermediate type: but all of them have no cell growth at pH 9. This laboratory report aims to summarize the microbiological results obtained.
Materials and Methods
The present laboratory study is carried out according to the instructions described in the method manual of the same name from Carolina Distance Learning. Under aseptic laboratory conditions, E. coli cultures were loop transferred to fresh nutrient media, labeled accordingly, when heated with a flame from a paraffin candle. A bacterial sample was loop transferred to a second sterile dish labeled with S. epidermidis.
Both cultures were then incubated vertically at room temperature: the sample preparation step was completed. Subsequently, six nutrient broth tubes were created so that there were three for each microorganism sample: with pH equal to 3, 7, and 9. Cultures were numerically transferred using a loop and incubated on the media for 24 hours. Observation tables were filled out after the first and second day on the fact of positive or negative growth.
Results
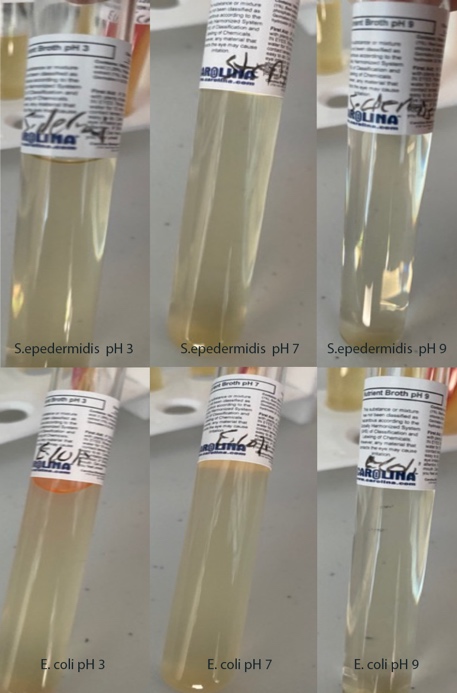
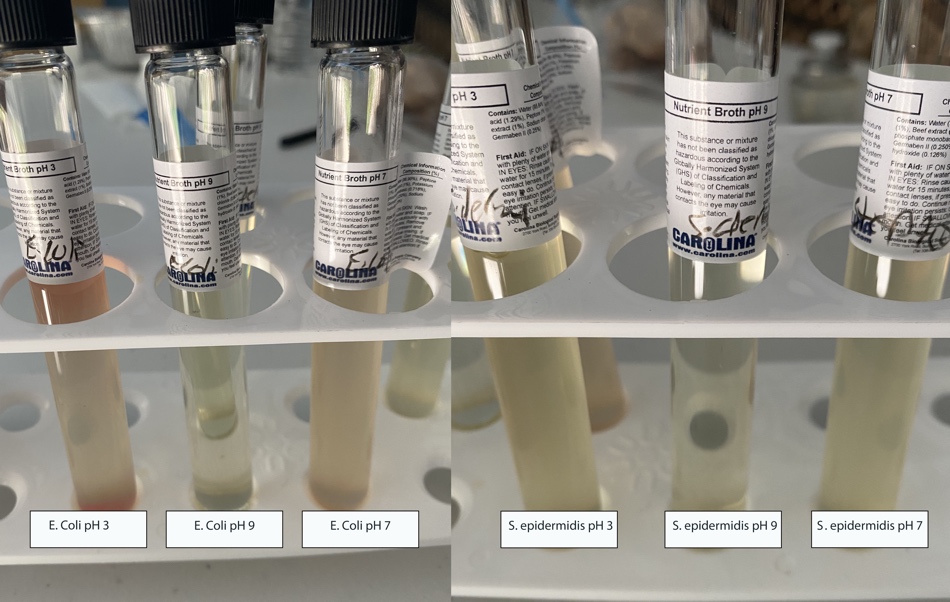
Because empirical observation of prokaryotic growth was performed by visual inspection 24 and 48 hours after the start of bacterial seeding, the use of images was chosen as the optimal form of demonstrating results. More specifically, it was clear that the growth of microbial lines in feeding broth tubes should be accompanied by the general turbidity of the solution. Thus, referring to Figure 1 shows the dynamics of this turbidity: each of the cultures has natural turbidity at acidic and neutral pH levels but is transparent at alkaline nutrient medium after 24 hours. After 48 hours, the E. coli tubes for the two lower levels of acidity acquired a characteristic pinkish tint, while both tubes with alkaline nutrient medium remained transparent.


Discussion
As it is known, the pH value in the solution medium is unambiguously determined by the concentration of hydrogen ions in the test tube. Therefore, the higher the hydrogen ion content, the lower the pH because the relationship between the two variables is negative and logarithmic (Helmenstine). Consequently, when discussing the activity or inhibition of microbial growth in media with different pH levels, it is appropriate to focus on the effect of hydrogen ion concentration on bacteria.
According to the given idea of the experiment, the turbidity of the test tube characterized cell growth, and the murkier the profile of the solution, the more intense the processes of cell division took place in it (Farrell 640). In contrast, the formation of a clear solution meant not only the absence of growth but also the potential death of the current colony. Figure 1 makes clear that both E. coli and S. epidermidis showed no growth one day after culturing at a pH of 9, as the solution became almost entirely transparent. Similarly, for results 48 hours later, tubes with the most alkaline medium remained transparent compared to pH equal to 3 and 7. This may indicate the impossibility of active growth and development of the selected cultures on alkaline media, which is confirmed by the results of similar studies (Thornton et al. 755; Stewart et al. 10). In other words, neither E. coli nor S. epidermidis are strict alkaliphiles.
The change in color for E. coli on the second day from cloudy yellowish to pinkish is remarkable. In fact, reference to Figure 2 demonstrates that for the two media with acidic and neutral pH, there was a change in the color of the nutrient solution, with the most significant dynamic characteristic of the acidic level. This result could either be evidence of a natural reaction of the Gram-negative bacterium to the carbohydrates in the nutrient broth or to active germination.
In addition, since the turbidity of the solution was chosen as a central measure of bacterial growth, it is fair to note that at neutral levels for both 24 hours and 48 hours, E. coli colonies showed the greatest turbidity. Consequently, hydrogen ion deficiency was detrimental for these cell lines because it did not meet their metabolic needs. At the same time, S. epidermidis had increased turbidity in a more acidic solution. This may describe E. coli as a typical neutrophil, whereas S. epidermidis should be regarded as a transient bacterial species, preferring an intermediate pH between acidic and neutral.
These findings are in excellent agreement with the available academic information, indicating the high reliability of the microbiological study performed. More specifically, Philip et al. described E. coli as characteristic neutrophils, with the authors finding that the most comfortable pH for intense cell growth should reach a pH of 6.5-7.5 (2). Similar results have been published for Gram-positive S. epidermidis, with an optimal pH of 5.5 for this bacterium (Hülpüsch et al. 2888). Taken together, this confirms the quality of the results in this laboratory work and helps to classify it as reliable and relevant material.
Conclusion
In conclusion, it should be emphasized that bacterial cell growth is equally dependent on both internal metabolic driving forces and external factors. Among the latter, the pH of the environment plays a significant role since changes in acidity can initiate growth arrest and, consequently, cell death. This postulate was applied in this laboratory work, where the growth activity for two types of bacteria, Gram-negative and Gram-positive, was evaluated using three different levels of acidity. It was found that E. coli and S. epidermidis should be considered as typical neutrophils because the highest growth activity was seen at a pH of 7. At the same time, no development was detected for alkaline nutrient medium, and thus it could be postulated that such a medium suppressed growth.
References
Hülpüsch, Claudia, et al. “Skin pH–Dependent Staphylococcus aureus Abundance as Predictor for Increasing Atopic Dermatitis Severity.” Allergy, vol. 75, no. 11, 2020, pp. 2888-2898.
Philip, P., et al. “Parallel Substrate Supply and pH Stabilization for Optimal Screening of E. coli With the Membrane-Based Fed-Batch Shake Flask.” Microbial Cell Factories, vol. 17, no. 1, 2018, pp. 1-17.
Ratzke, Christoph, and Jeff Gore. “Modifying and Reacting to the Environmental pH Can Drive Bacterial Interactions.” PLoS Biology, vol. 16, no. 3, 2018, pp. 1-8.
Helmenstine, Anne. ” How to Calculate pH – Formula and Examples.”Science Notes. n.d. Web.
Farrell, Charlotte, et al. “Turbidity Composition and the Relationship with Microbial Attachment and UV Inactivation Efficacy.” Science of the Total Environment, vol. 624, 2018, pp. 638-647.
Thornton, L. A., et al. “The Effect of Urine Concentration and pH on the Growth of Escherichia coli in Canine Urine in vitro.” Journal of Veterinary Internal Medicine, vol. 32, no. 2, 2018, pp. 752-756.
Stewart, Elizabeth J., et al. “Effect of Antimicrobial and Physical Treatments on Growth of Multispecies Staphylococcal Biofilms.” Applied and Environmental Microbiology, vol. 83, no. 12, 2017, pp. 1-12.