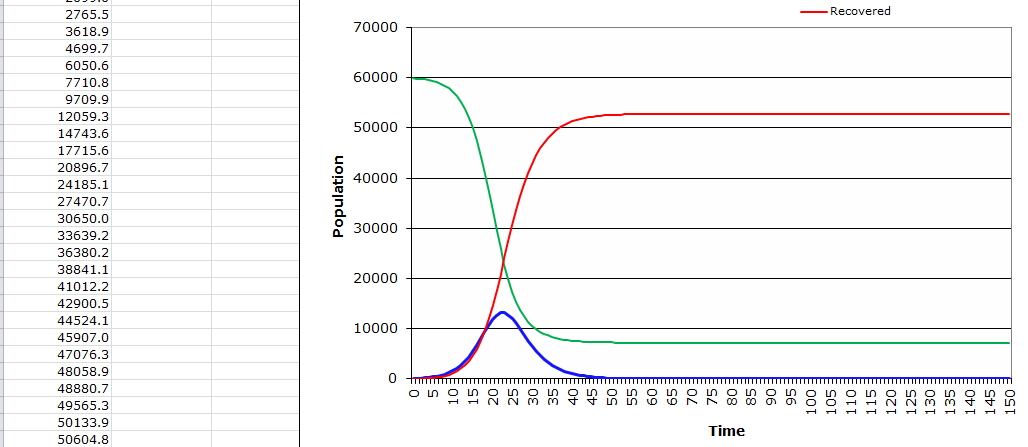
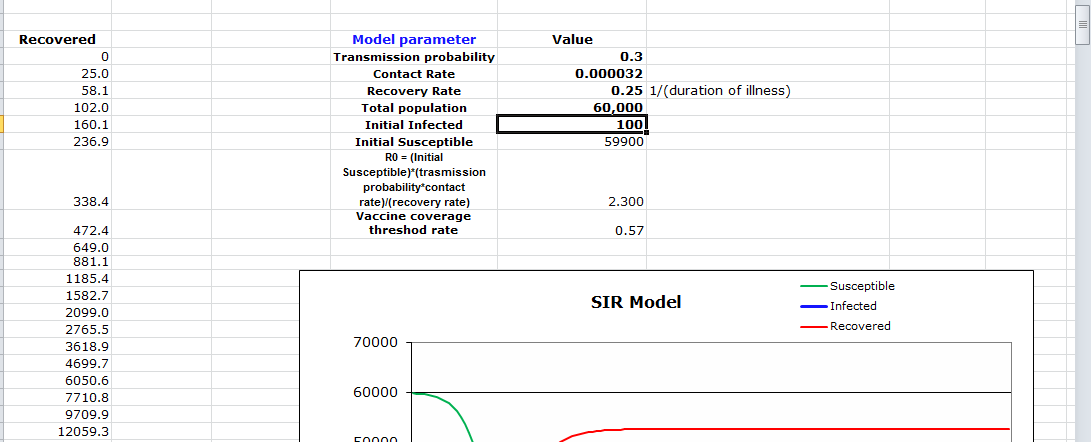
The City Department of Health has found out that a very infectious strain of influenza (transmission probability 0.3) is likely to hit soon, for which the current vaccine is not practical. So far, the DOH thinks about 100 people in the city have been infected. We know that influenza illness usually lasts for an average of 5 days, and for every 1000 people who get influenza, 1 person requires intensive care for two days. The population in the city is 80,000. The R0 (the basic reproductive rate) for this influenza strain has been estimated to be 4.
Use the SIR model in the Excel spreadsheet to answer the following questions. Hint: make sure you parameterize the model correctly before you start.
The contact rate for the epidemic is 0.0000835,
The formula used and the calculations are shown below:
I evaluated using the R formula
R0 = (Initial Susceptible)*(transmission probability*contact rate)/(recovery rate)
And the result
79900*0.3*x =4
0.5
= 4*0.5
79900*3
= 0.0000835
The above recipe yields a particular number as the contact rate. The given R0 value is set as 4. As such, it is possible to achieve the contact rate by essentially applying the equation shown above, subsequently making it more straightforward to come out with the appropriate response. The calculations are additionally laid out on the dominant picture below, which is the least resistant path.
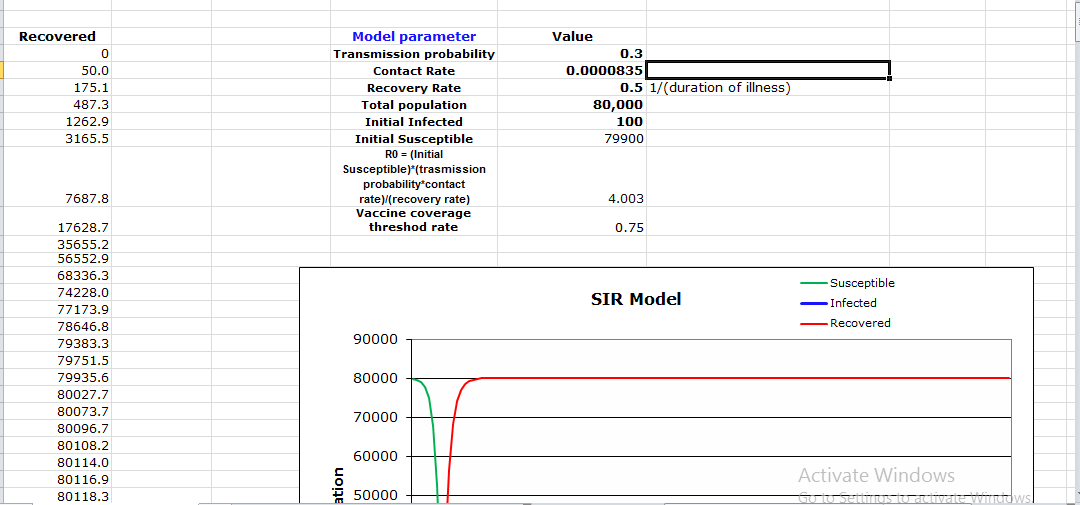
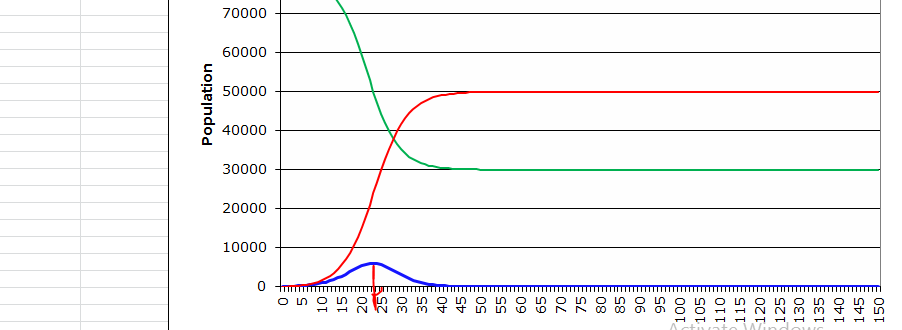

The calculations are shown in the above picture.
In this case, the pinnacle is set apart by the red bolt since it is the second when the epidemic sets at a high rate. At that point, an individual is prone to the infection and the rate of transmission is elevated. Furthermore, if an individual comes into contact with another person at this time, they will communicate the infection more promptly than at some other time or period. The computations are displayed above on the dominant picture, and they yield that point as the pinnacle. However, people here are simply advised to retain minimal contact with each other with the aim of reducing the rate of infection. The peak of the infection is the point at which the epidemic transmits at a higher rate than normal. In a population of about a thousand people, it can infect almost three-quarters of the people and thus, this is the peak. The calculations are shown above in the picture, and they show the peak period of the viral infection. As such, it can be considered an easy method for determining the peak of the epidemic. The peak is the time that the disease transmits at a higher rate, and the individuals in the population are at the highest risk of infection.
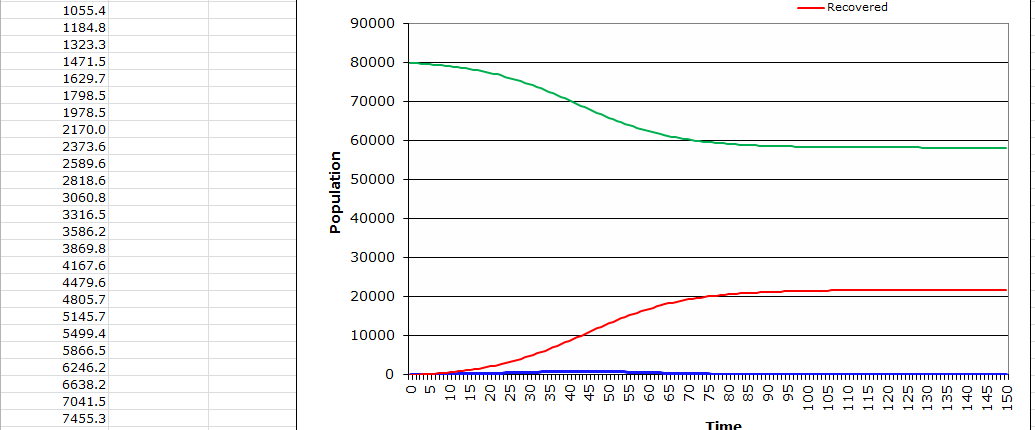
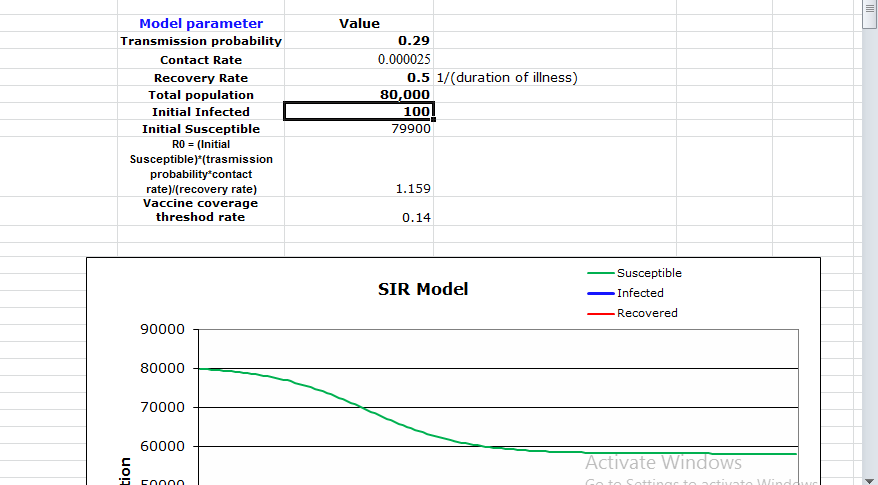
The approach will ensure that there are satisfactory ICU beds at the apex of the pandemic as the results reflect the number of recovered individuals. The number of the affected is not large, mainly because the number of the infected people diminished to a point known as the balance point. ICU beds can hold the affected number of people at a time, which shows that the DOH is ready to deal with the epidemic. The result is, by all accounts, that the population at this point is not at high risk of infection. Since the infected individuals are secluded and taken to ICU beds, where they get treatment while in confinement, the contact rate is reduced, making it possible to lower the rate of infection in the target population. The computations are laid out in the model above. Besides, the calculations provide the correct results that empower one to foresee the issue about the ideal number of ICU beds in such a situation.

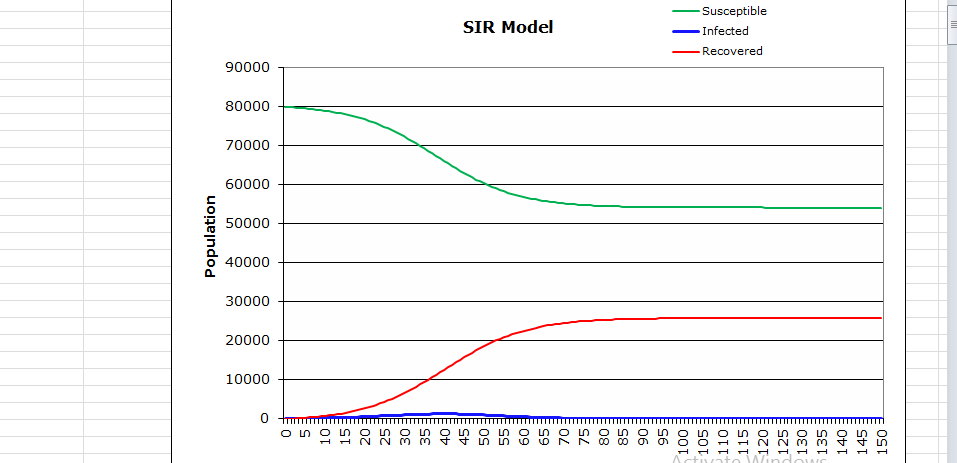
There was a slight increment in the number of affected individuals. Specifically, this demonstrates that the ICU beds are inadequate to meet the demand. The increment shows that the accessible ICU beds were not adequate to serve the high number of patients. This portrays that without the utilization of covers, the epidemic rate is high along these lines, making it difficult for the access number of ICU beds to meet the demand. The computations are displayed on the model above, showing the slight addition that yields an answer. In this case, the calculated answer demonstrates that without the use of veils, the transmission increases at a high rate. The accessible ICU beds cannot hold the higher number of contaminated people, making it hard for the city to control the epidemic.
The pinnacle point in this situation is slightly expanded because the inoculation readily immunized 25% of the population (20000 people). The top value is achieved by deducting 20000 from the absolute population since the previously mentioned 20000 individuals are resistant to the infection. The estimation is displayed on the image shown in the excel sheet below. When contrasted with question 2, the pinnacle expanded at a specific rate.
