Why it can Prevent Excessive Consumption
The government’s intention to set the minimum price for alcohol products is based on the concept of price floors. Under this concept, the minimum selling price is set above the equilibrium prices (Frank, Bernanke & Kaufman 2007, p. 71). For example, equilibrium price for Grant’s whisky was 11 pounds before the proposal. However, it will rise to 11.42 after implementing the proposal.
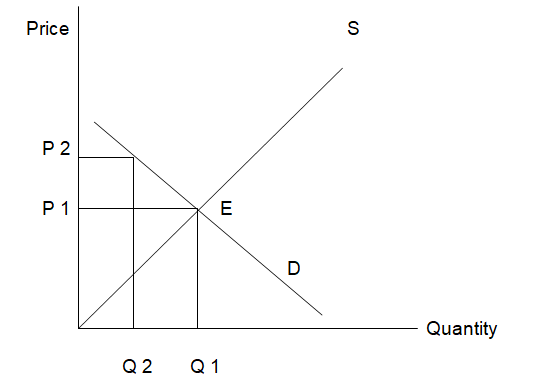
The increase in equilibrium price leads to a reduction in quantity demand. This is illustrated in figure 1 below. P 1 and Q1 represent the initial equilibrium price and quantity respectively. However, the equilibrium price will rise to P 2 after implementing the government’s proposal. When the price increases to P 2, the quantity demand will reduce from Q 1 to Q 2.
This is because consumers will find alcohol products more expensive than they were initially (Frank, Bernanke & Kaufman 2007, p. 73). This implies that raising the minimum price above the market equilibrium will reduce the consumption of alcohol.
Figure 1: price floor
P: price
Q: quantity
E: equilibrium
S: supply curve
D: demand curv
Why the Proposal will not succeed in this Case
Influencing the consumption of alcohol through price control depends on the price elasticity of its demand (Frank, Bernanke & Kaufman 2007, p. 94). The demand for alcoholic drinks such as beer tends to be relatively inelastic due to the following reasons. First, the prices of alcoholic drinks in UK are very low due to the promotions run by supermarkets.
For example, the price of a bottle of wine is as little as 2.03 pounds. This means that the price represents only a small percentage of consumer’s income. Thus the demand for alcohol will be inelastic since the consumers will not be sensitive to price changes (Frank, Bernanke & Kaufman 2007, p. 95). Second, alcohol is a necessity to those who are addicted to it.
Thus unless its price is significantly increased, consumers will still purchase it. Finally, loyalty to particular brands of alcohol will encourage consumers to maintain their level of consumption even if the prices are raised (Frank, Bernanke & Kaufman 2007, p. 97). These trends indicate that the price of alcohol must be increased significantly in order to reduce its consumption.
Thus the government’s proposal will fail because its new price proposals are not significantly high. It is for this reason that earlier proposals fixed the minimum price at 50p instead of 38p as proposed by the government.
Importance of the Concept of Scarcity and Opportunity Cost
Scarcity implies that that the available resources can not satisfy all the needs of a country or a business (Pindyck & Robinfeld 2009, p. 22). Scarce resources are only spent on projects associated with the highest levels of benefits. Thus scarcity leads to trade-offs when allocating resources. Trade-offs in this case means that some projects must be forgone due to lack of adequate resources.
Such trade-offs are associated with opportunity costs which represent “the next best alternative” (Pindyck & Robinfeld 2009, p. 23). Scarcity helps governments to realize the fact that they have limited resources. Opportunity cost on the other hand helps governments to asses the costs and benefits associated with their decisions in regard to resources allocation (Pindyck & Robinfeld 2009, p. 23).
Thus the main importance of the concept of scarcity and opportunity cost is that they help governments to make informed decisions on the use of their resources. This helps in maximizing the benefits resulting from efficient resource allocation. This can be illustrated by the alcohol market in UK.
Scarcity in this case is represented by the fact that the government does not have enough resources to prevent the side-effects of alcohol consumption such as increased crime rate. The government must deicide on whether to promote consumption of alcohol in order to increase its GDP or reduce alcohol availability in order to protect the health of the citizens.
This represents the trade-off that the government must make. Since the government has decided to reduce alcohol availability, the opportunity cost is represented by the revenue lost due to reduction in alcohol consumption. Thus the two concepts have helped the government to determine the level of alcohol production that is both beneficial to the producers and the citizens.
Taxation of Alcohol, Cigarette and Petrol
The above goods are taxed for two reasons. First, they are taxed in order to generate revenue for supporting government operations (Pindyck & Robinfeld 2009, p. 54). For example, the revenues are used to provide services such as education. Second, they are taxed to prevent market failure. Market failure occurs when the free market can not allocate resources efficiently (Pindyck & Robinfeld 2009, p. 55).
The above goods lead to market failure since their consumption is associated with negative externalities. A negative externality is “a cost not transmitted through prices, incurred by a party who did not agree to the activity causing the cost” (Pindyck & Robinfeld 2009, p. 56). Air pollution is one of the negative externalities associated with the consumption of petrol and cigarette.
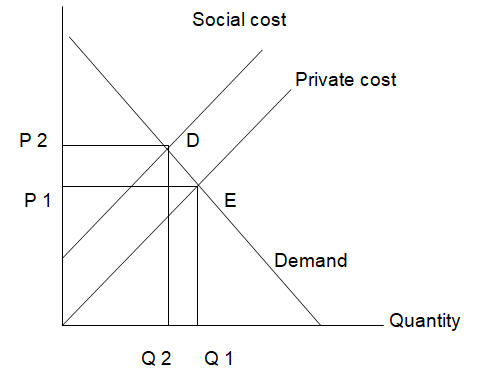
Increase in crime rate and road accidents are the negative externalities associated with alcohol consumption. Prevention of market failure through taxation is illustrated by figure 2 below. When the market equilibrium is at point E, the marginal cost associated with the private sector is less than that associated with public sector.
This means that increasing the production of the good will be less beneficial. Thus in order to achieve the ideal equilibrium, pint D, the price must be raised to P 2. This is achieved through taxation in order to increase the price of the product.
Figure 2: negative externality
P: price
Q: quantity
E: actual equilibrium
D: ideal equilibrium
Reducing the Incidence for Alcohol Consumption
Education
Consumption of alcohol can be reduced if the public is educated on the effects of its consumption. As the citizens realize the side-effects of alcohol such as health risks, increased crime rate and road accidents, they will reduce alcohol consumption (Pindyck & Robinfeld 2009, p. 66). This can be illustrated by figure 3 below. D 1 represents the demand for alcohol before introducing the education programs.
At this level, the equilibrium price and quantity are P 1 and Q 1 respectively. After the education program, the demand curve will shift to D 2. Thus the quantity demanded at the same price, P 1, will reduce from Q 1 to Q 3.
Following the reduction in demand, alcohol producers are likely to reduce the prices in order to encourage consumption. Consequently, the new equilibrium price and quantity will be P 2 and Q 2. The overall effect of education is that the quantity demanded will reduce from Q 1 to Q 2.
Figure 3: demand-supply model
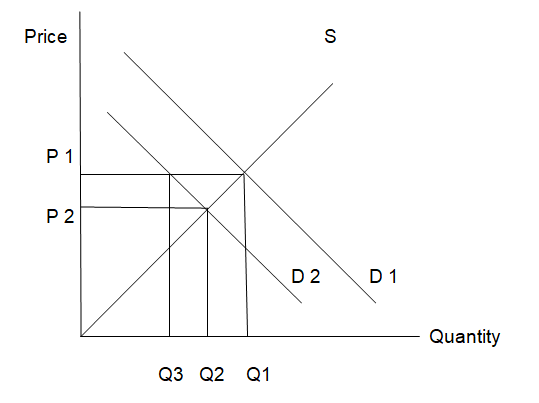
P: price
Q: quantity
D: demand curve
Taxation
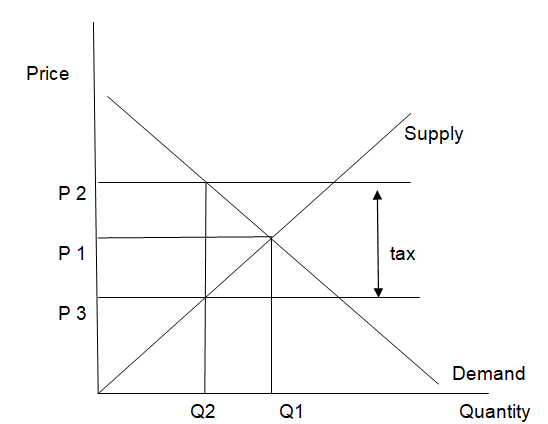
Taxation increases the price of alcohol. According to the law of demand, an increase in price translates into a reduction in the quantity demanded (Pindyck & Robinfeld 2009, p. 67). Thus imposing taxes on alcohol will make it more expensive hence discouraging its consumption. This can be illustrated by figure 4 below. Before imposing the tax, the equilibrium price and quantity will be P1 and Q 1 respectively.
After imposing the tax, the price paid by buyers will increase to P2 while that received by sellers will reduce to P 3. Thus the quantity demanded will reduce from Q 1 to Q 2. Following the reduction in demand, the producers of alcohol will reduce the supply level. Thus the overall effect of taxation will be a reduction in the quantity demanded due to an increase in the price of alcohol.
Figure 4: incidence of taxation
P: price
Q: quantity
The Energy Market in UK
In 2007, the government of UK introduced price control in the energy market (National-grid 2007). This involved lowering the prices of both electricity and gas. To achieve this objective, the government subsidized the production of both gas and electricity (National-grid 2007). The main goal of the price control was to lower the prices of gas and electricity so that many citizens can afford to use them.
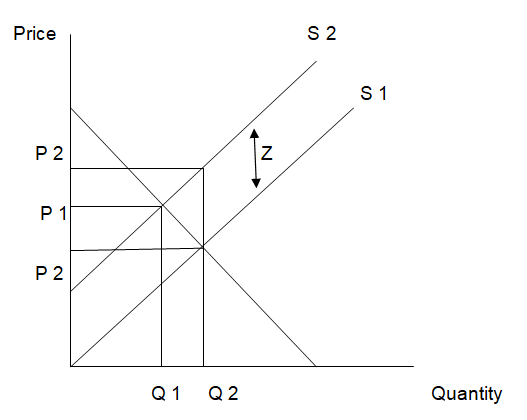
Besides, the use of electricity and gas causes less air pollution. Thus the government intended to promote the use of the above sources of energy in order to conserve the environment (National-grid 2007). The success of this strategy can be illustrated by figure 5 below. Before introducing the subsidy, the equilibrium price was P 1 while the equilibrium quantity was Q 1.
However, the price paid by the buyers reduced to P 2 after the introduction of the subsidy. The price received by the sellers increased to P 2+ Z, where Z represents the amount of subsidy per unit. Since P 2+ Z is higher than the initial equilibrium price, the sellers increased the quantity supplied from Q 1 to Q 2. The overall effect of the subsidy was a reduction in the price of electricity and gas as well as an increase in their demand.
Figure 5: subsidy
P: price
Q: quantity
S: supply
Z: subsidy
References
Frank, R, Bernanke, B & Kaufman, R 2007, Principles of economics, McGraw-Hill, New York.
National-grid 2007, The use gas and electricity distribution price control, <https://www.nationalgrid.com/>.
Pindyck, R & Robinfeld, D 2009, Microeconomics, Pearson, New York.