Introduction
Nestlé SA (Nestle) manufactures and markets beverages and food items, such as cereals, baby food, confectionery, bottled water, ice cream, and pet care goods. The organization sells its products under Nescafe, Nespresso, Nido, Milo, Maggi, Buitoni, Kit Kat, and other brands (Nestlé, 2023a). As a multinational enterprise, Nestlé’s operations span many geographical areas, including Asia (Nestlé, 2023f). This report aims to employ Ghemawat’s AAA framework to explore Nestlé’s global strategy and use various financial indicators to assess its performance.
AAA Analysis
Ghemawat’s framework provides three generic approaches that can help examine how Nestlé creates value globally. A company must have a competitive value proposition to realize high sales (Climent & Haftor, 2021). These may include a collection of tangible goods, services, or extra attributes with a superior fit to consumer needs (Nestlé, 2023b). The core dimensions of the AAA model are adaptation, aggregation, and arbitrage.
Adaptation
Nestlé’s agility to adapt to international markets and develop local, regional, and global brands contributes to long-term financial performance. Some products the company has adapted to suit local requirements and preferences include KitKat, offered in different flavors in Japan and the United States (Wiener-Bronner, 2023). Additionally, brands such as Nescau and D’Onofrio are local and only found in Brazil and Peru, respectively (Brazil and Co., 2023; CBA B+G, 2023). Others are found in specific continents, such as Africa, the Middle East, and Asia, including Maggi, Milo, and Nido (Nestlé, 2023a). Despite being among the company’s famous brands, modern consumers have increased health consciousness and need healthy offerings. 99% of candy and ice cream products, 96% of Nestlé’s beverages, and 70% of food have been reported to be unhealthy (Hickey, 2021). The organization must adjust production and marketing style per local requirements and expectations.
Aggregation
This component can help examine how Nestlé implements various strategies to meet customer expectations, save money, and generate revenue. The company has 275,000 employees worldwide, sells its products in 188 nations, and operates over 340 factories in 77 countries (Nestlé, 2023c). These enable Nestlé to utilize advantages derived from an extensive distribution network to increase market reach. Additionally, the organization’s decentralized supply chain, research and development (R&D), and extensive distribution network help diversify its product portfolio and reach its target audience (Nestlé, 2023d). Similarly, these internal capabilities and resources allow Nestlé to leverage economies of scale and expertise to offer exclusivity and differentiation.
Arbitrage
This element defines how Nestlé benefits from qualities associated with different regions or saves costs from varying prices for raw materials in different markets. In this case, an asset must be similar or identical for a company to take advantage of price differences in various markets (Montoya-Cruz et al., 2022). For example, Nestlé sources its grains and cereals worldwide, with most of these supplies originating from Brazil, Argentina, Mexico, Australia, Russia, the United States, and the United Kingdom (Nestlé, 2023e). The company’s strategic sourcing enables it to capitalize on differences in production costs and access high-quality inputs. Similarly, it allows Nestlé to diversify its supply sources, which may be essential in mitigating disruptions during geopolitical tensions or adverse weather conditions.
Performance Assessment
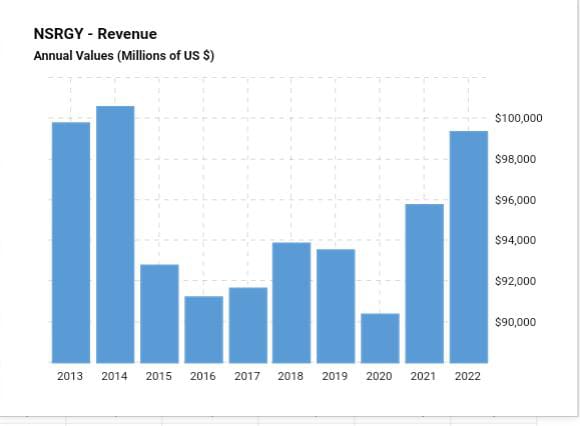
Nestlé has been successful in its global arena with a stable revenue for the last five years (see Appendix 1). In the year ending 2018, the returns on investment were estimated to be over $93.8 billion (Macrotrends LLC, 2023). However, during the peak of the COVID-19 pandemic, profits reduced to $93.4 and 90.3 billion in the year ending 2019 and 2020, respectively.
Nonetheless, the food manufacturer was not adversely affected by the pandemic compared to some of its competitors. The company reported a 4.9% growth in sales, which was driven by strong demand for coffee, pet food, and health products (Koltrowitz, 2020). This helped Nestlé offset a slump in food sales to cafes and restaurants. The following period saw an upward performance, with $95.7 billion in revenue reported in 2021 and $99.3 billion in 2022 (Macrotrends LLC, 2023). These statistics provide a clear position of Nestlé’s financial health.
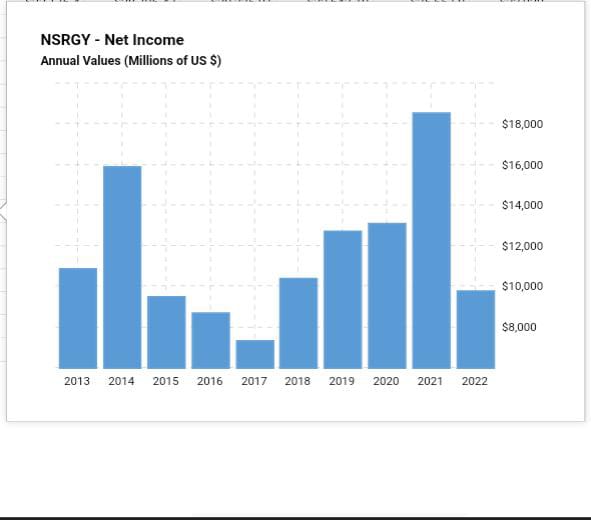
Nestlé’s net income has been stable, which demonstrates effective financial management. The company recorded profits of $10.3, $12.7, $13, $18.5, and $9.7 in 2018, 2019, 2020, 2021, and 2022, respectively (see Appendix 2). The fall in net income in the past year has been attributed to more costly ingredients due to inflation, prompting Nestlé to increase its commodities’ prices by 8.2% (Revill & Naidu, 2023).
The firm has a strong presence both in domestic and international markets. It garnered a profit of about CHF40 billion in the Americas and CHF30 billion in Europe, the Middle East, and North Africa (EMENA), while CHF28 billion in Asia, Oceania, and Sub-Saharan Africa (Nestlé, 2023f). Additionally, Nestlé’s product portfolio spans various segments, including powdered and liquid beverages, care nutrition and health science, prepared dishes and cooking aids, milk products and ice cream, confectionery, and water, with sales reported to be CHF25.2, CHF18.1, CHF15.7, CHF12.5, CHF11.3, CHF8.1 and CH $3.5 billion, respectively (Nestle, 2023f). Thus, these financial indicators, net income, net profit margin, and sales, indicate the organization’s global performance.
Recommendations
Enhance Adaptation Efforts
Nestlé can leverage its internal resources by making significant R&D investments to develop and market products that align with the changing trends. A report shows that 55% of consumers are inclined to spend on premium healthy foods due to their health and wellness benefits (Edsall et al., 2022). Therefore, Nestlé must continuously monitor some of the trends that drive consumer demand. The proactive approach will enable the company to be responsive by manufacturing products, especially those that support healthier lifestyles. Thus, increasing cultural nutrition awareness requires Nestlé to be agile by reformulating or remarketing its goods.
Diversify Supply Chain
Nestlé should look for other alternatives to source the ingredients it uses to produce its products. The company can make long-term contracts with affordable and reputable sources. This can make it resilient against raw material price fluctuations and reduce passing on higher costs to financially struggling customers (Revill & Naidu, 2023). Similarly, supposing cost inflation cannot be avoided, public awareness should be provided to educate consumers about the reasons behind the price hikes. When these strategies are employed, it may help Nestlé stabilize costs and manage consumer expectations.
Conclusion
Nestlé’s operations are spread worldwide with a diverse product portfolio, including D’Onofrio and Nescau, which are curated based on the tastes and preferences in the local markets. Nestlé’s decentralized supply chain and robust distribution network also support its global strategy because it ensures that different products are within market reach. Although the company’s financial performance has been stable, it is recommended to continue pursuing adaptation and diversification.
References
Brazil and Co. (2023). Achocolatado em Pó / Chocolate powder Nescau – Nestlé (200g). Web.
CBA B+G. (2023). D’onofrio reserva: Time knows best. Web.
Climent, R. C., & Haftor, D. M. (2021). Value creation through the evolution of business model themes. Journal of Business Research, 122, 353-361. Web.
Edsall, D., Bhatt, J., Johnson, E, & Young, S. (2022). Fresh food as medicine for the heartburn of high prices. Deloitte Insights. Web.
Hickey, A. (2021). Nestlé vs. nutrition: 70% of the company’s food items, 96% of beverages, and 99% of candy and ice cream products don’t meet a ‘recognized definition of health,’ new report says. Business Insider. Web.
Koltrowitz, S. (2020). Nestle shrugs off COVID-19 impact thanks to pet food and health nutrition. Reuters. Web.
Montoya-Cruz, E., Ramos-Requena, J. P., Trinidad-Segovia, J. E., & Sánchez-Granero, M. Á. (2020). Exploring arbitrage strategies in corporate social responsibility companies. Sustainability, 12(16), 1-17. Web.
Nestlé. (2023a). Brands A-Z. Web.
Nestlé. (2023b). Generating value through our strategy. Web.
Nestlé. (2023c). Locations. Web.
Nestlé. (2023d). Innovation, science and technology. Web.
Nestlé. (2023e). Cereals and grains sourcing. Web.
Nestlé. (2023f). Facts and figures. Facts and figures | Nestlé Annual Report.
Revill, J. & Naidu, R. (2023). Nestle plans price hikes after costs eat into profits. Reuters. Web.
Wiener-Bronner, D. (2023). Kit Kat’s coolest flavors aren’t sold in the US. Here’s why. CNN. Web.
Appendices

