Introduction
The oil and gas industry is a very broad industry where many different sectors and engineers complement one another in order to deliver the most efficient performance. By referring to the performance, it means the operation system tracked by the production capacity of the company. Indeed, during performance safety remains as the leading priority. Several techniques and methodologies are used to increase the operation capability. In the production stage, a good number of such techniques are related to certain mechanical systems known as the artificial lift. However, the artificial lift appears in several types and play different roles in regard to the type and conditions of the well. Actually, these may include the pump jack and the plunger lift.
Purpose
This report aims to illustrate how to optimize the wells that involve a plunger lift through converting its measurement system from analog to digital. In order to do that one ought to justify whether installing the electronic measurement system is profitable or not for the future of the company. This is palpable by running an economic case and meets the regulations in all cases. Subsequently, this would make it easy to demonstrate to the Company’s upper management whether the conversion is feasible for the rest of the 28 wells. It also becomes possible to advice the company to remain with the current analog system in anticipation of extra studies and proper optimization is accomplished.
Methodology
The justification of this conversion will be determined via choosing three wells for testing purposes. These wells must be initially visited in order to install the new measurement system to enable optimization upon them. At that point access to the production data and figures of such wells as well as the other software tends to assist in employing the changes. Access may be done through the main office other than visiting the field for each stage of the project. In case of any immediate needed changes, the proactive interaction with the field technicians will take place.
Background
Company
TAQA is the sixth global energy company that has operations in nearly eleven countries around the world. Every branch of TAQA has a specific sector of energy investment depending on the country of investment, distinctions, and needs. TAQA NORTH is subsidiary company that caters for the operations in North America. The subsidiary company covers the provinces of Alberta, Saskatchewan, and British Columbia in Canada. The Company adapts to oil and gas exploration in Canada. The project is done by joining the development department in the area of Eastern Alberta particularly Central Mature team. Each team involves at least a geologist, geophysicist, a production engineer, an exploitation engineer, as well as an asset manager. In this case the asset manager is the leader of the team and also the direct supervisor. Every single member of the team has his/her own role that adds a significant value to any project.
Plunger lift
Plunger lift (figure 1) is an artificial lift type. It is a tool that is specifically used in the gas wells as a long-term solution in a specific circumstance that occurs in the gas well. Initially, the gas well produces normally. By the time the vapor water flows with the gas upwards, it is condensed at the tubing wall. Afterwards, it falls back and accumulates at the bottom of the tube. Subsequently, the increment of fluid volume at the bottom enables the gas flows to become dilatory until it stops flowing towards the wellhead.
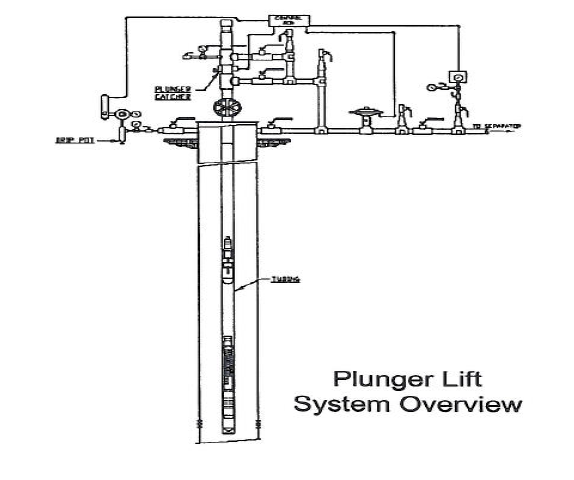
Plunger lift
The plunger lift removes all the liquids from the bottom of the tube and allows the gas to flow normally again (Dan, Lynn & Gordon, 2005). Therefore, it is a tool that raises the well’s productivity in the long term. There are many types of the plunger lifts such as the brush, cleanout, ultra seal, soldering, and dual pad as demonstrated in figure 2. There are various factors that possess direct effect on the velocity of the falling trip of the plunger. These include the age, diameter, friction with tubing, and the plunger-tubing seal effect. Different operators usually have different preferences for the types of plunger lift in regard to their diverse manufacturing features. For instance, different types may be made of a solid piece or multipart with wide or thin diameter to determine the efficiency that is manifested by its capability for water removal.
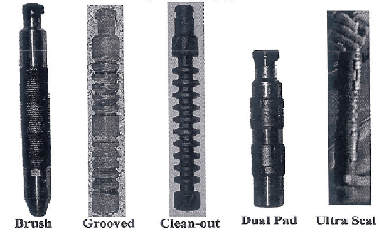
Analog (Chart systems)
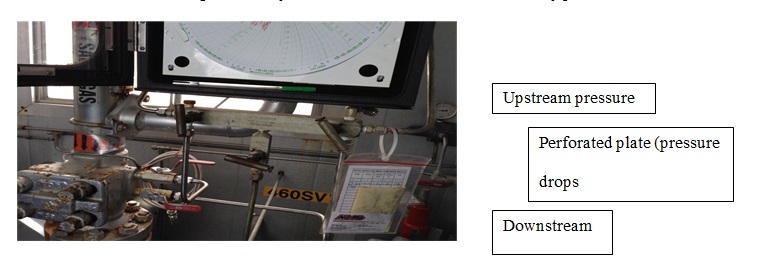
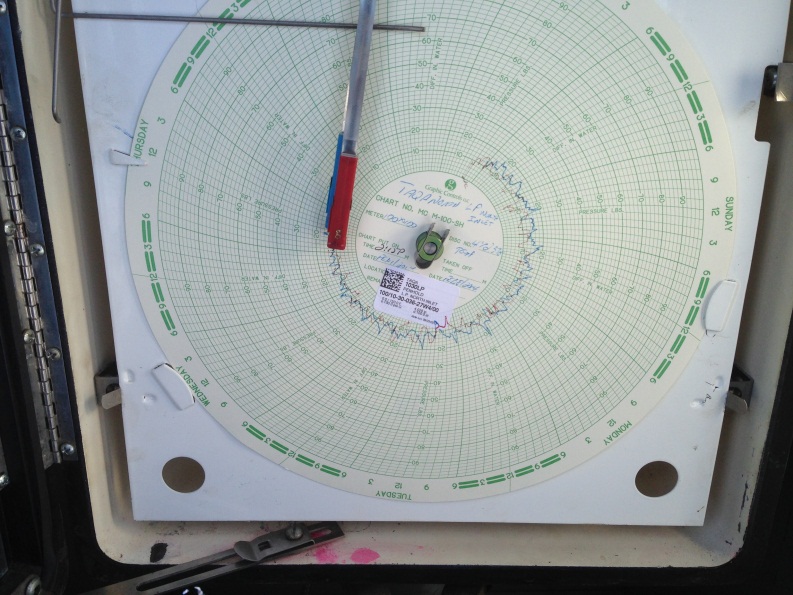
There are several methods for measuring the plunger lift mechanism and adjusting its movement. Linking the measurements system to a controller sitting is the most significant factor in determining the performance of the plunger lift and subsequently the gas well productivity. The measurement system that is used currently is called the chart system (Dan, Lynn & Gordon, 2005). The system as in figure 4 is a circular chart paper working as an analog system that records the data for the production and flow rate. Similarly, the system provides some measurements like tubing pressure, casing pressure, and temperature. The manner in which the chart system works determines the gas flows to the lubricator. The flow passes through a region containing upstream and downstream tubes with sensors as illustrated in figure 3. In between, there is a plate with a hole in the middle. When the flow passes, the upstream sensor records the first pressure before that pressure drops as it passes through the hole. In contrast, the downstream sensor records the second or differential pressure that determines the flow rate. In addition, both the sensors record the temperature. However, each sensor is connected to the chart through the small tubes that moves small pens which draw cycles on the chart (Dennison, 2013). This shows the after flow period, the loading period, as well as the shut on and shut off time. Nevertheless, there are some disadvantages of this system that is to be discussed in the body part into details.
Digital (SCADA systems)
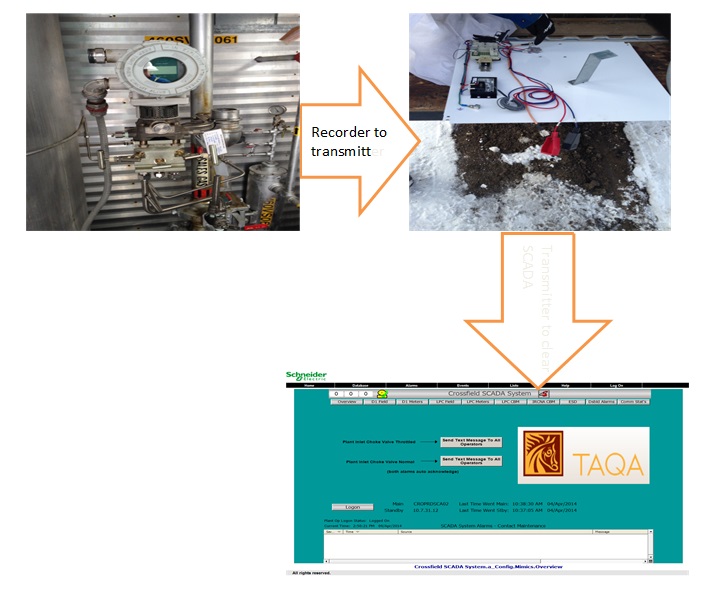
In order to optimize the work of plunger the engineers usually convert the measurement system into a more advanced digital system called supervisory control and data acquisition (SCADA) system. The SCADA is an automated measuring and controlling system for the industrial processes. It is an electronic flow measurement (EFM) type that is a specific controller and gives more advantages to the operation to be analyzed. The process of measurement goes through main stages based on the installation. The recorder machine does almost the chart job of recording the data automatically (Dennison, 2013). The transmitter machine on the other hand transfers these data via a wireless connection into the clear SCADA setting in the operator’s office as demonstrated in figure 5.
UWI explanation and project location
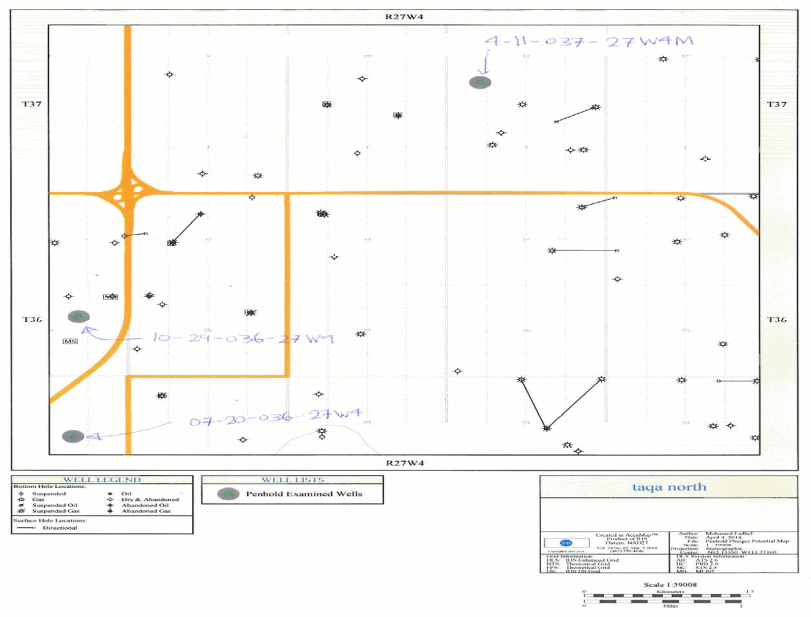
The UWI also named unique well identifier is a location identifier of the wells, facilities, lands, pipelines, pools, and roads in the province of Alberta. Based on UWI, the entire public data is recorded in all the oil and gas software. It consists of the township and a meridian intersection. The location is divided into 36 sections with each section involving 16 units. Hence, the determined and examined well locations in this project include 04-11-037-27W4M, 0-29-036-27W4M, and 20-036-27W4M. Basically, for the purpose of justifications, the software called Accumap aids in showing the specific mapping system as shown in figure 6.
Analysis and Results
Current state: Chart system
The chart system has some disadvantages that should be evaluated deeply. To start with, the chart system is an old measurements system that does not have the ability to control or adjust. A
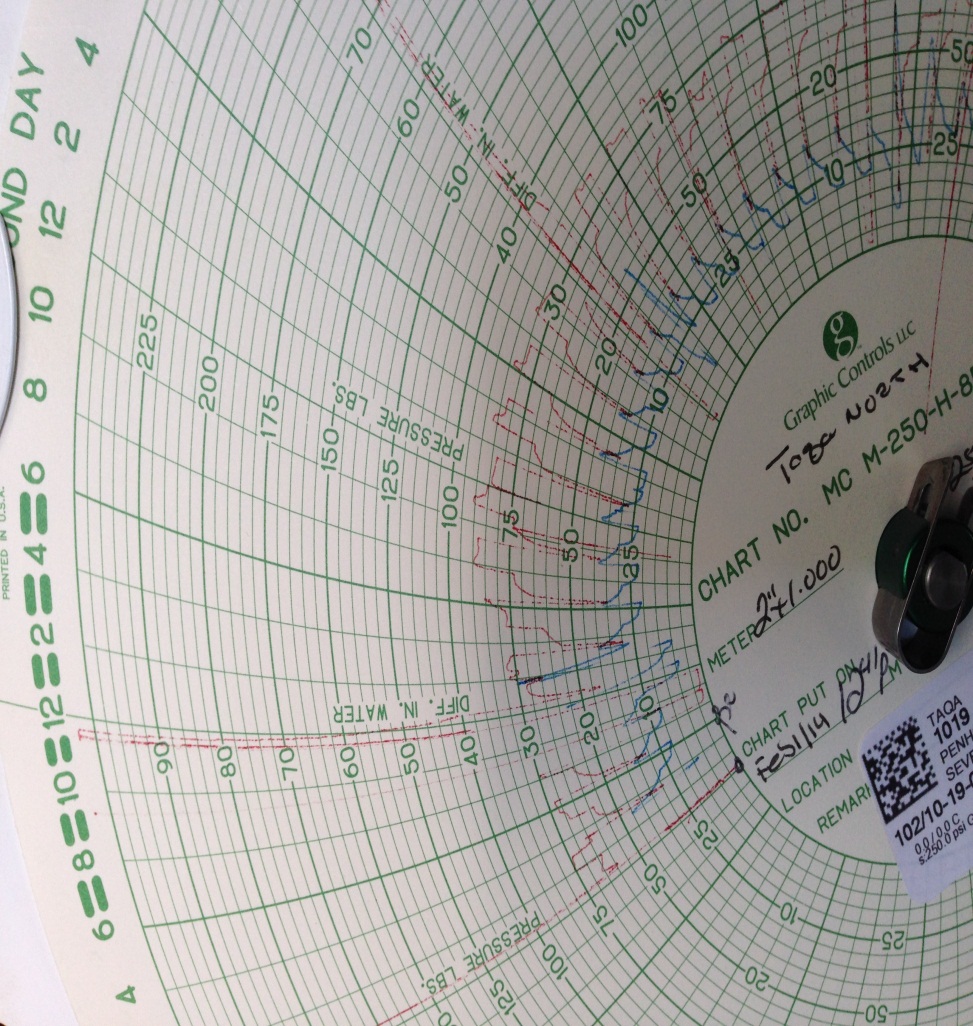
ctually, it simply measures and keeps the data. Furthermore, it does not save the data for a long time. The problem results from the fact that most of the chart sheets have duration of one week maximum. Therefore, it requires a periodic follow up by the operator in order to record the data and check the operation. Supposed the gas is missing at the plant, the operator must make the adjustment in the plunger work manually (McManus, 2013). The system is accurate and the likelihood of human error in getting the data and measurements is slightly possible since scaling is very small as shown in figure 7. Hence, optimizing either the productivity or the efficiency of a plunger well is invalid in this method.
Converting Optimization
Maximize the production
The optimal production capacity gained out of the gas well is by optimizing the plunger setting in the controller. In order to achieve this, the usage of SCADA system is significant (MTRAC, n.d). Maximizing the production using SCADA mainly occurs through two important differences. Primarily, in the chart system it is noticeable that the line exceeds the chart range. This represents a loss in production as presented by the red line in figure 7. The situation always occurs at the beginning of each day’s cycle when the plunger starts to flow in (McManus, 2013). This problem is hard to fix while maintaining the chart system. Moreover, SCADA provides the ability to monitor and manage time of the loops per day, the velocity of the plunger lift, and the flow periods such as loading versus shut in durations. Ultimately, the system fixes the remaining process on a preferable state. The operator has to try different plunger cycle periods through shutting the plunger on and off for a better production. Besides, the operator ought to check the system using quicker and more loops that allow small buildup of fluids. The operator may also wait for the fluid to build up for a long time and let the plunger remove it via the use of slower and fewer plunger cycles. The mechanism eventually helps the technician to determine the proper number of hourly or daily loops. This allows the plunger and the well to perform effectively until the optimal production is reached (MTRAC, n.d.).
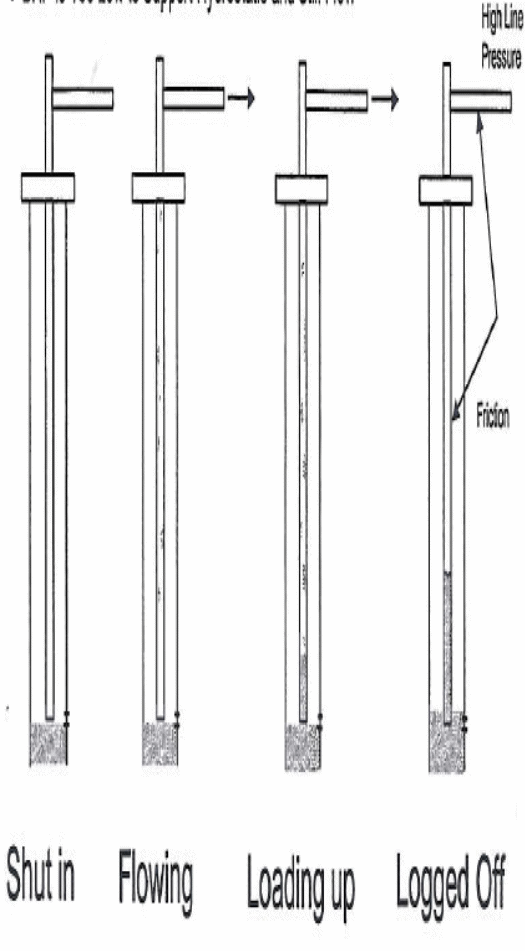
The cycles demonstrated in figure 8 shows that the periods are very similar to one another in that once the operator makes his adjustments, the plunger should perform in compliance with the regular sitting. Each cycle has two main stages, the flowing period that usually loads the liquid and the shut in period in which the well is not flowing while the BHP (bottom whole pressure) is building up.
In order to meet the optimization task, focus is laid on three main directions so as to come up with solid evidence on the incremental portion. At first, the past experience of the field operators maintains that SCADA system would have an approximate of 1 e3m3/day in average. They expect that the sustained uplift increases in the future as proved by other converted sites of the company in different areas. The second evidence is based on the case stating that any type of electronic measurement system increases the volume by 10 to 40% in consistency with the operator’s estimation. The third proof emerges in the installed SCADA system on the three wells under investigation. The fact is supported by the clear SCADA access to two of the three wells with the adjustments on such wells. In consequence, the production history of the two wells, period of SCADA installation, the kind of changes made, as well as the results achieved are revealed.
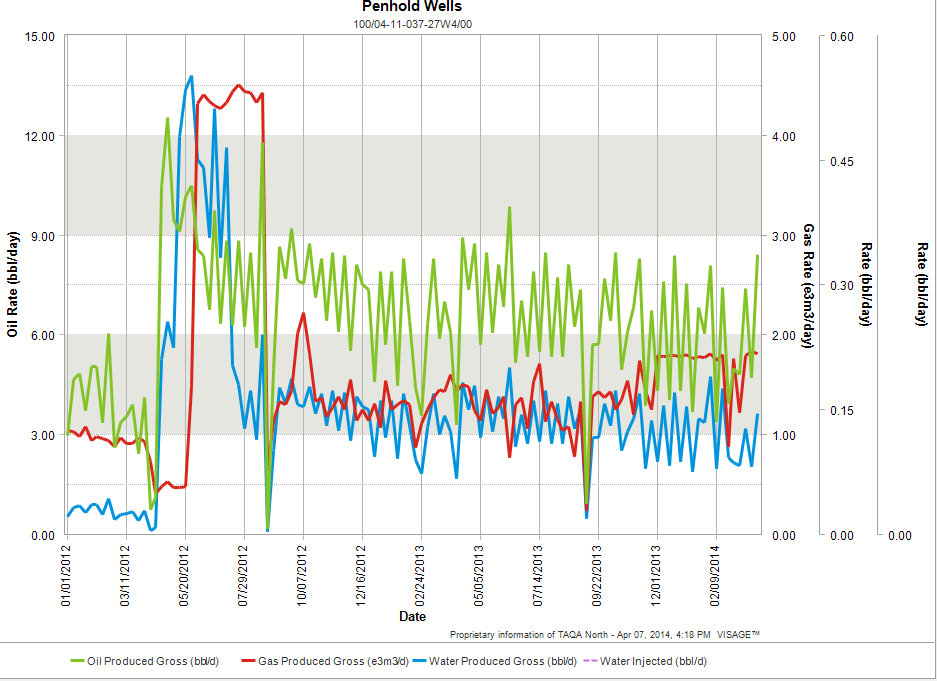
The plan (figure 9) shows the flow rate versus the time for the well which is 04-11-037-27W4M. The red, green, and blue lines represent gas, oil, and water respectively. The plunger lift was installed in June 2012. Therefore, in approximation it is possible to obtain a remarkable jump in the gas production from 1e3m3/day to 2e3m3/day. Similarly, the oil went from 2bbl/day to 2.5bbl/day. Under the same facility, water had an increase in volume. SCADA was installed right at the end of the period of April 2014. Yet, the volume increases due to SCADA optimization cannot be observed as a result of the fact that more time required. Nonetheless, certain developments have been done so far and it is apparent that clear SCADA might give some better results in the meantime.
Four main components versus time are demonstrated in figure 10 to help in obtaining the result. The blue line represents the static pressure of the gas in the wellhead while the red line shows the differential pressure. In fact, the differential pressure is the most important in determining the flow rates of the gas illustrated in black line. Finally, the green line describes the behavior of temperature throughout the period.
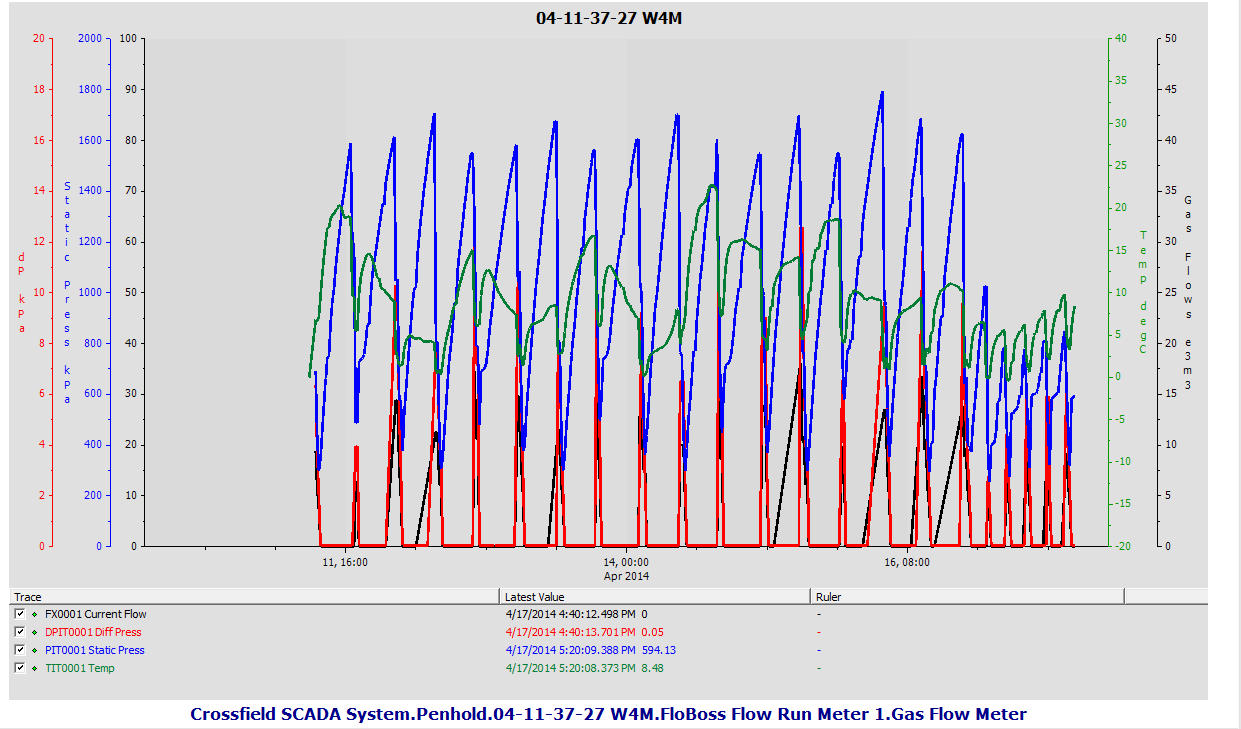
As the graph shows the initial installation of SCADA, a cycle of seven hours shut in and one hour flow provides a total of three flowing hours per day. This is considered to be a very small flowing period. Accordingly, the arrow points at the first setting variation done by changing it into three hours for the shut in time with one flowing hour in each cycle. This allows for the raising of the flowing periods into 6 hours a day. The shut in time was not adjusted to more than three hours. It is due to the fact that it was necessary to originally check whether that time was sufficient for the well bottom to build up enough pressure. Similarly, this would enable the plunger to get to the surface. Supposed the plunger did not make it to the surface, it was possible to decide on the next adjustment to be applied. Obviously, a four shut-in hours and two flowing hours in each cycle would be applied. The adjustment would allow the bottom hovel gravity to build more pressure and have extra flowing periods of eight hours per day. Unfortunately, due to the limited time the adjustment result was not shown appropriately.
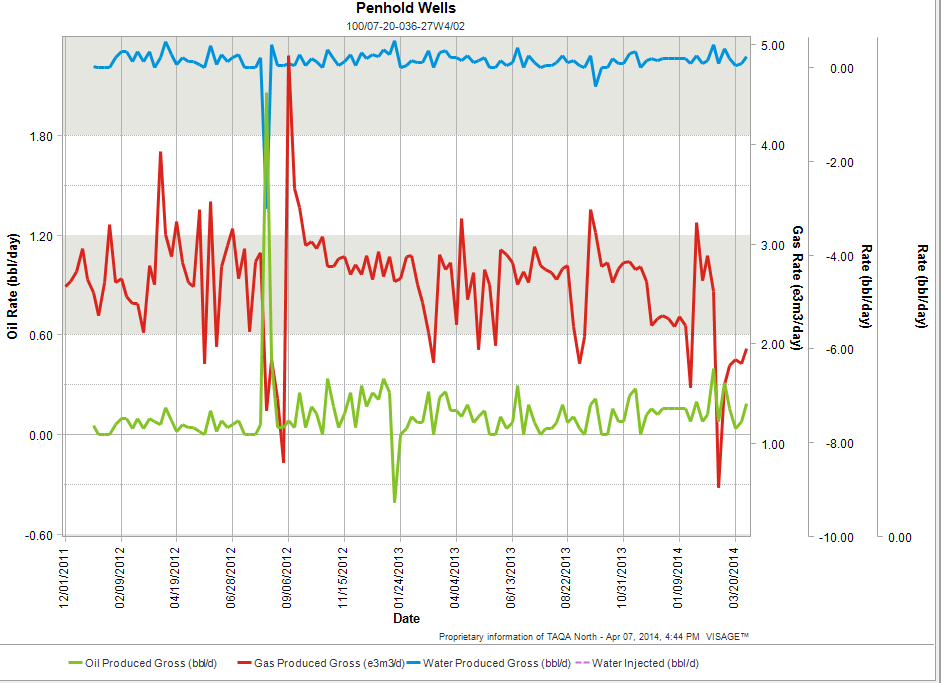
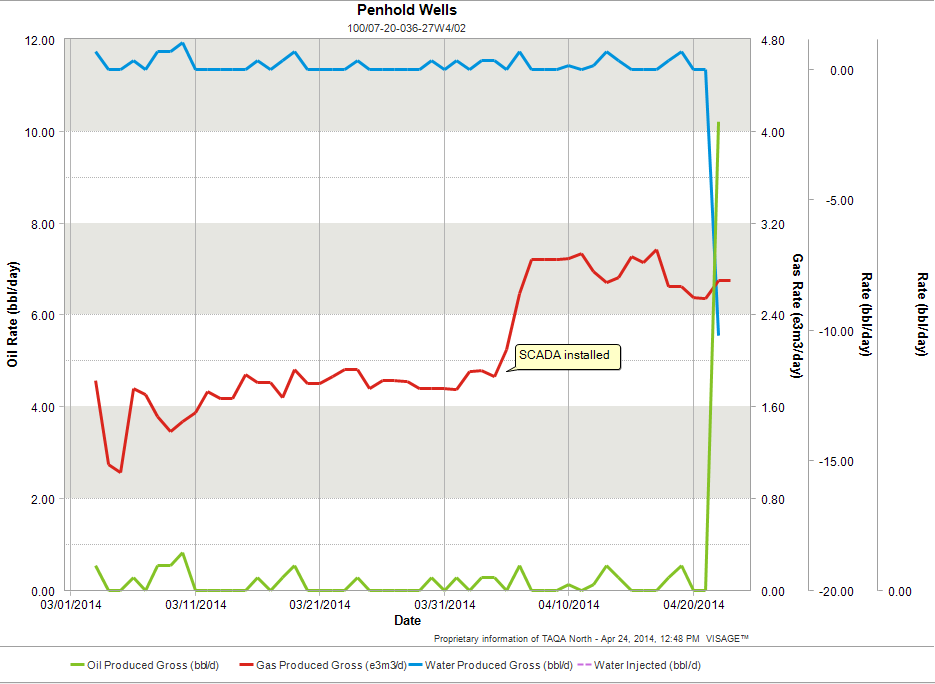
The next well to optimize was well 07-20-036-27W4M. The plunger was installed in June 2010. As presented in figure 11, the increase in the gas volume from the sustained 2 to 2.8 and then to 3e3m3/day is evident. However, the production was slightly reducing as time goes. The amount of oil and water remained stable. The installation of the SCADA system in the well took place on April 3rd 2010 with appropriate adjustment setting the optimization right in order to have adequate time.
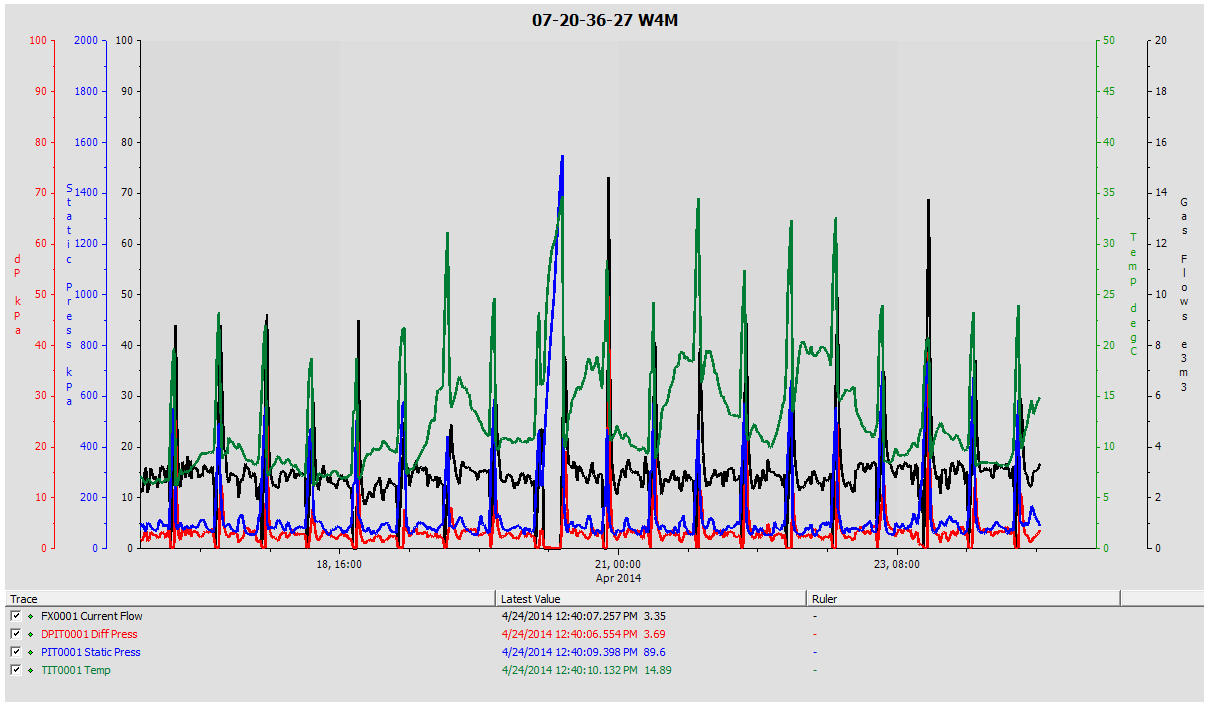
In this trial, the cycles periods were set based on the previous set of the chart setting. Consequently, it has 21 flowing hours per day due to a single shut in hours and seven flowing hours in each cycle. The plunger has therefore made it to the surface successfully. This means that there is enough loaded bottom hovel pressure produced in one hour shut in period with a proportional static and differential pressure in the flow rate represented in figure 12 throughout the whole period.
By looking at the focused production graph for the last two months in figure 13, the tremendous increase is evident through conversion to SCADA. The gas rate has a sustained increase of approximately 1e3m3/day (from 1.8e3m3/day to 2.8e3m3/day). Yet, the rates of oil and water remain constant. There may be more optimization by testing the reduction of the shut in time for less than one hour before check if it is the best time for the pressure to build up. Though, this is the accomplishment expected for the residual 28 plunger wells.
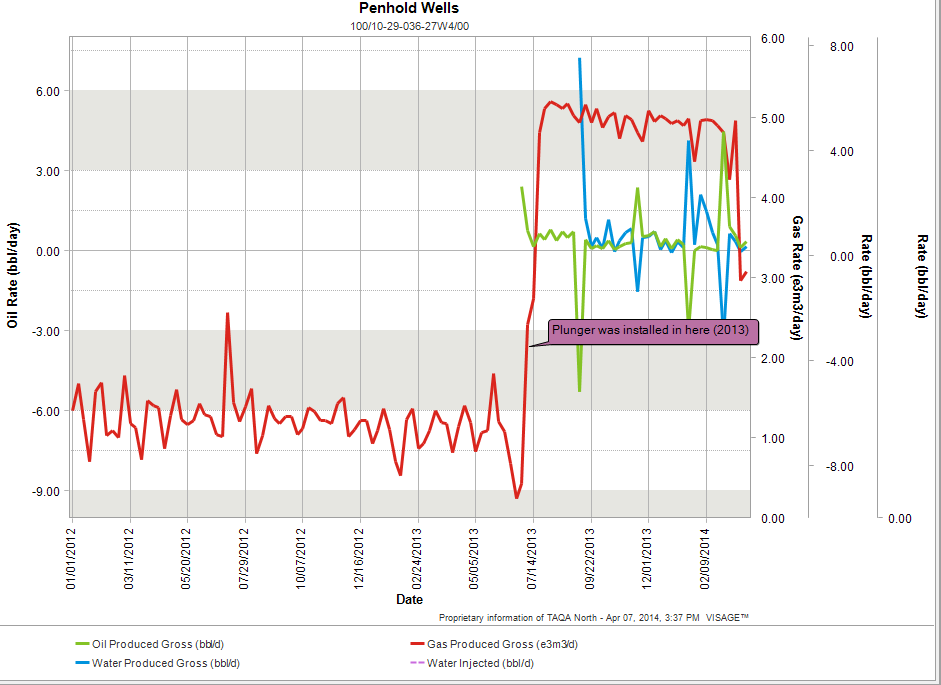
Finally, the third examined well was 10-29-36-27W4M. Going over the production history, it is clear that there is a dramatic jump of the gas flow rate in July 2013 caused by the plunger installation. In fact, the rate rose from 1e3m3/day to 5e3m3/day. Prior to that, the well was put into a swabbing program that did not work properly hence forcing it to be replaced by the plunger. Unfortunately, access to the clear SCADA in this well is not ready hitherto. The same estimation would apply for the 1e3m3/day uplift by SCADA. Even after the loss has been controlled, the final revenue might not be changed due to other reasons like the prorated factor of the SCADA production. Other factors like production by chart, allocation of all wells to one measuring station, and partnership of facilities or production of wells as shared between various companies. In this context, all the three wells operations belong to the TAQA NORTH Company. Thus, any increase in the volume would have a direct impact on the revenues.
Minimize the operation cost (Opex)
There was an expected cost reduction caused by the conversion. In the case of the Chart system, the operator had to drive to the well every day or every second day. In the SCADA case, there was less operators’ visits (30%) as assumed by the field machinists while 70% of the operators still visited the field from time to time from different grounds of operations for checkups. As a result, there was less access clearing from tilling the lease roads or doing some maintenance due to the effects of winter weather in Alberta. There could be cost savings by eliminating the costs of the weekly chart alteration as well as scanning and sending the charts. Hence, the operators’ estimation of the main costs and roads maintenance reduction was 50%. The other half of the cost resulted from different site trips meant for different purposes. The costs were estimated due to an allocation of expenses to every individual well.
For the three wells, savings were taken for the last three years for more accuracy and to distinguish any irregular figure. Nevertheless, all the years spent were quite lower than what was expected as they fall within the convenience range. The average savings taken from the three years in a row showed a slight difference in each year due to several reasons. Among the reasons include the yearly weather effects that affected the maintenance costs, expenditure, or the budget allocated in that specific year.
For well 4-11-37-27W4, the average savings per year was $ 1307.20. This was not a very extraordinary saving given the aforementioned reasons as demonstrated in table 1. The costs of labor along with roads and maintenance are higher as compared to well 10-29-36-27W4.
Table 1: Costs and Savings for well 4-11.
For well 10-29-36-27W4, the average reduced cost was $874.20 per year as shown in the summary of table 2. The well is considered to have less visiting costs compared to the other two wells. That might be the reason for the close distance between the operator office and the site. The table clearly illustrates the yearly costs ranging from labor as well as roads and maintenance to help the Company determine the total savings.
Table 2: Costs and Savings for well 10-29.
Basically, well 7-20-36-27W4 has a higher cost reduction based on the opposite reason compared to the previous wells that saved higher labor costs. Thus, the well has the highest savings per year which is $ 1537.83 as elaborate in table 3.
Table 3: Costs and savings for well 7-20.
Economic Justification
In relation to the economics of the project, the first factor to look at is the capital cost of the SCADA system machine installation. The cost is at $5000 devoid of the RTU (remote terminal unit) equipment. Yet, the cost ranges to $10,000 with the RTU equipment in place. This takes into account the annual operations and wireless connection fees that remain very small along with the maintenance costs. As a result, there is a safe estimated margin by the operators that the cost could not exceed $5000 mark. This would make the total capital cost of the installation to be $15,000 in each well. In addition, the expected production rise over the coming five years might be 1e3m3/day (thousand standard cubic meters per day) that equals 35.5mcf/day (thousand standard cubic feet per day). The estimation is in terms of the savings as most of the wells are located far from the operator’s office. Thus, the average reduction cost for each well per year is equal to $1500.
In regard to the previous values and assumptions, a peep case that is software was run for the economic aspect of all the oil and gas projects. In order to run the case, two sequential cases had to be created. The first case was a base case where all the assumptions were stated. The other case was where the volume of uplift effect was added to the basic one. After that, a consolidation run showed up the results. The net present value of the project was $126000 for each well. The value was believed to be a positive value. The ten percent discounting productivity index was 8.4 more than 0.3 that the company’s policy requires. Since this project was considered to be a small project, the payback standards target was six months or less. This included a payback period of 4.5 months that was consistent with the policy of the entire project. The summary of economic indicators for the successful project is demonstrated in table 4. Hence, it is possible for the project assistants to estimate their financial projections for the remaining wells.
Table 4: Economics summary.
Other SCADA benefits
Apart from the quantified parts of the project, there are other advantages of SCADA that can be shown in the long term. As was presented before, SCADA is known to let the operator do all the measurement and setting of the optimization through offices other than visiting each site. The factor allows the operators to deal with more plunger wells in the shortest time possible. As a result, there is less waste of operator’s time that can be invested in other field operations, follow up, and base management optimization. SCADA has the specialty for monitoring the plunger velocity that permits the operator to adjust to the arrival time of the plunger to the surface based on the velocity. That is a very important aspect for increasing the safety and performance. Equally, the property guarantees the plunger lifts that have high friction with tube wall that can sabotage it, those that can get damaged, or ones that cannot reach the wellhead at the stipulated time. Subsequently, this provides for a longer equipment life besides reducing the maintenance costs.
Regulations
There was a recent regulation launched by the government of Alberta that requires any corporation to have an EFM method for any well that involves an artificial left tool such as the plunger lift. The justification for the SCADA installation project shows that it is a beneficial alternative for the oil and gas companies. Supposed the economic justification showed us negative results, an exemption request for perseverance using the chart system for a longer time would be a valid solution. Interestingly, this would force the Alberta energy regulator (AER) back and provide them with evidences that this is a non-profitable and non-effective transfer for the company. The other exceptions had already been offered by the AER. These comprised of the utilization of individual batteries for shorter time chart periods in the wells that would cost more time and money.
Conclusion
In conclusion, it is elaborate that before the conversion to SCADA the system optimizes the plunger lift mechanism. This owes to the fact that it allows the company to raise the volume of production by 1e3m3/day over the looming years by reaching the appropriate setting. Similarly, the aspect enables the company to save an average of 1500 in each plunger well in every financial year. As stipulated in the economics, the success of the project is in the short term while recognizing the long-term benefits. Therefore, it becomes easy to believe that conversion of the measurement system is justified and the regulations are properly met.
Recommendations
Several recommendations are made as established on the site visits made, data observed and analyzed, as well as the economics results. It is thus recommended to spend funds in converting the entire 28-plunger wells measurement from chart to SCADA in Penhold area. Likewise, converting the other TAQA NORTH plunger wells in other areas apart from Penhold should be considered. Besides, it is important to provide more studies of SCADA setting optimization effect on different well types (oil or gas). Ultimately, the company must try and quantify the other benefits of SCADA and put them in accurate figures for better justifications.
References
Dan, P., Lynn, R., & Gordon, G. (2005). Plungers lift optimization and troubleshooting. Denver, Colorado: Gas Well De-Liquification workshop.
Dennison, R. (2013). SCADA system assessment. Maple Grove, MN: EPG Companies Inc.
McManus, B. (2013). Directive 017: Measurement requirements for oil and gas operations. Calgary, Alberta: Alberta Energy Regulator.
MTRAC (n.d). Optimal plunger lift operation: Intelligent, self-adjusting wellhead management system. Web.