Updated:

Organizational Study: Statistical Analysis Coursework

Exclusively available on Available only on IvyPanda® Made by Human No AI

Scenario 1

SPSS Output
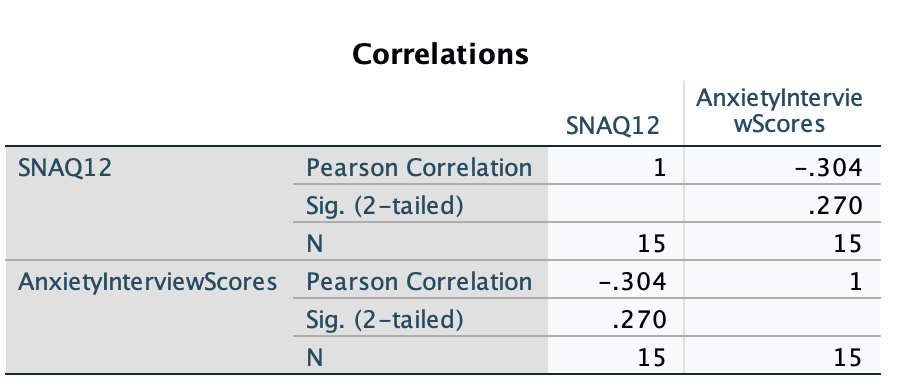
Correlations

Results

The purpose of the present correlation analysis was to identify the nature of the relationship between respondents’ perceptions of generalized anxiety that may have been experienced and scores on the SNAQ-12 scale assessing snake phobia. The results showed that the overall correlation between the variables were insignificant at an alpha of.05, and thus the Pearson correlation coefficient could be explained by any numerical overlap between the data in the sample, r(13) = -.304, p =.270. Increasing the sample size, entailing an increase in statistical power, could allow the significance of the correlation to be detected, if observed at all. Figure 1 shows the scatter plot for the data: we can clearly see that no observable trend in the distribution is apparent. In other words, one cannot even approximate how the SNAQ-12 scores change as the generalized anxiety interview scores increase. As a general corollary, it can be concluded that no significant correlation was observed between snake phobia and generalized anxiety.
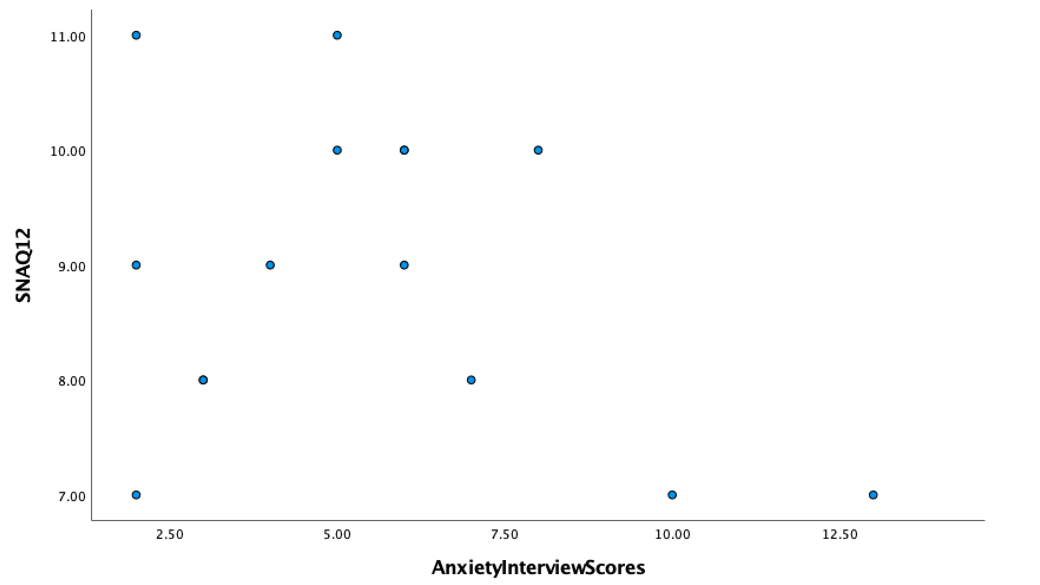
 Scatter Plot for SNAQ-12 Variables and Generalized Anxiety Interview Results
Figure 1: Scatter Plot for SNAQ-12 Variables and Generalized Anxiety Interview Results

Scenario 2

SPSS Output

Correlations

Results

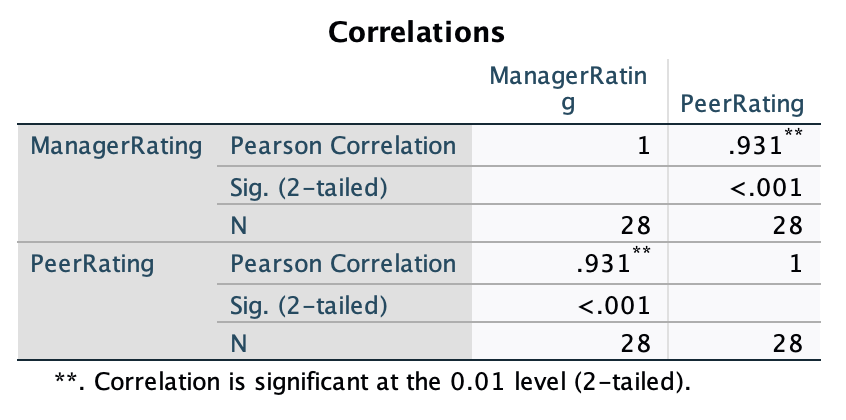
The purpose of this statistical analysis was to evaluate the strength and direction of the relationship between two variables in an organizational study. The variables are the rating of employees’ leadership potential as assessed by peers and managers. Thus, the purpose of the analysis is to look for a potential relationship between how management and peers rate employees, if such a relationship exists. The results show that there is a significant correlation between grades from peers and grades from managers, r(26) =.931, p <.001. The Pearson correlation coefficient indicates a strong positive relationship between these variables, meaning that when grades from managers increased, there was a simultaneous increase in grades from peers and vice versa. The scatter plot shown in Figure 2 for the sample confirms this relationship based on an upward trend. Thus, in the context of organizational research, it is true to conclude that there was a significant positive relationship between employee leadership potential evaluations from peers and from managers.
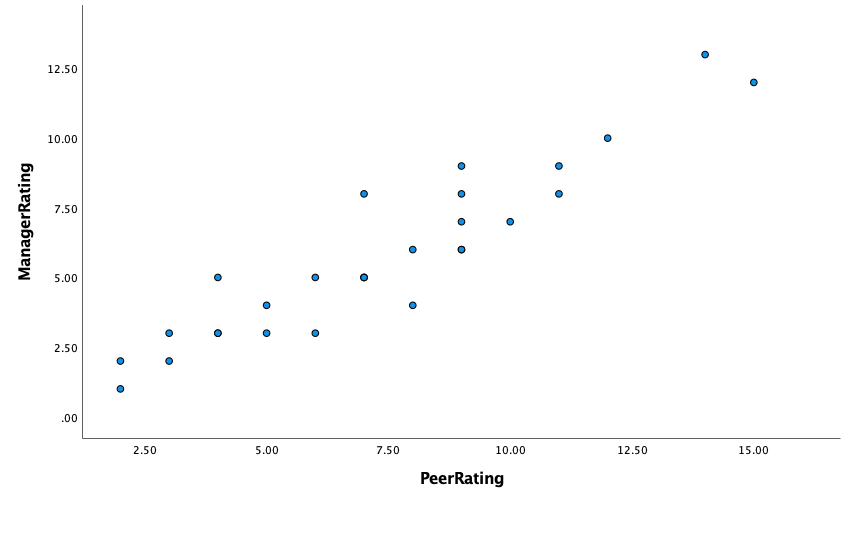
Scatter Plot for Manager Rating and Peer Rating Variables
Figure 2: Scatter Plot for Manager Rating and Peer Rating Variables

Scenario 3

SPSS Output

Descriptive Statistics

Tests of Between-Subjects Effects

Multiple Comparisons

Results

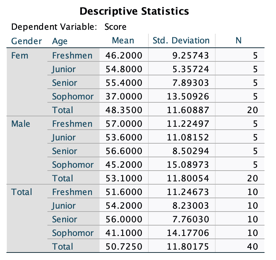
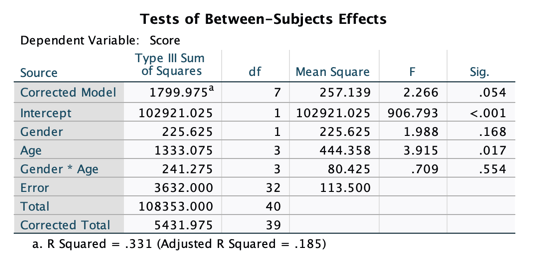
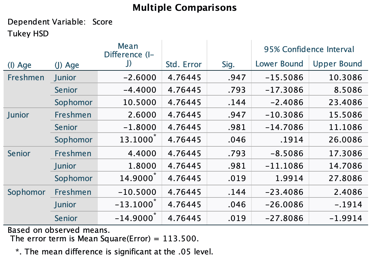
As part of this part of the statistical analysis, it was necessary to determine the existence of a potential relationship between year of study and age as independent factors, and perceptions of campus safety. Four cohorts for each of the two gender categories were assembled: each cohort had five participants who rated their own sense of safety on a 70-point scale (1 to 70): 40 respondents in total. A higher score corresponded to a perception of increased feelings of safety, while a lower score indicated the opposite. To simultaneously compare such safety across gender and age characteristics, it was necessary to use a two-factor ANOVA analysis to compare averages across cohorts (Bevans, 2022). The test results demonstrated that only the variable of age, that is, student affiliation with a particular year of study, was a significant predictor of differences in feelings of safety, F(3, 32) = 3.915, p =.017. This implies that students of different years of study differentially felt safe, but that this perception was not associated with gender identity. The a posteriori Tukey test used to find the location of such differences demonstrated that significant differences in perception existed between Junior and Sophomore, and between Sophomore and Senior: in both cases, Sophomores felt the least safe on campus, as Figure 3 suggests.
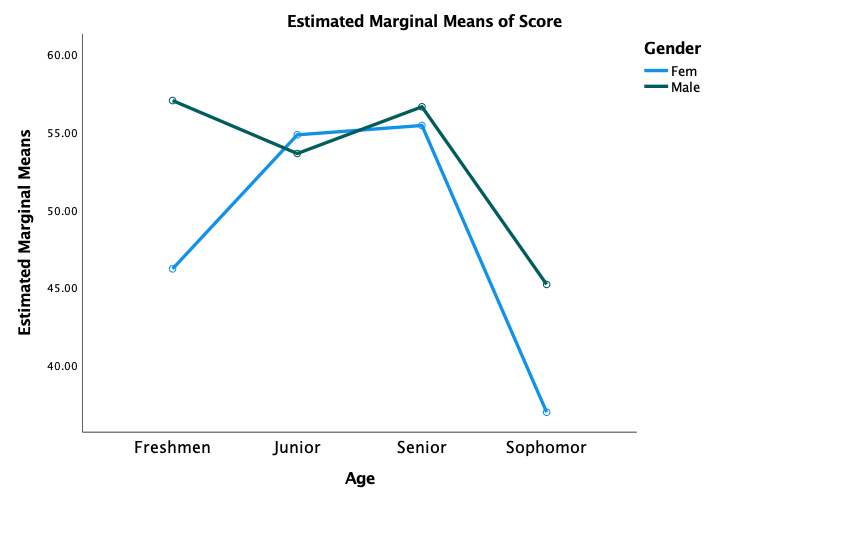
Multiple Line Graph for Students of Different Ages in Perceptions of Campus Safety Levels
Figure 3: Multiple Line Graph for Students of Different Ages in Perceptions of Campus Safety Levels

Reference

Bevans, R. (2022). . Scribbr. Web.

More related papers Related Essay Examples
Cite This paper
You're welcome to use this sample in your assignment. Be sure to cite it correctly

Reference

IvyPanda. (2024, May 18). Organizational Study: Statistical Analysis. https://ivypanda.com/essays/organizational-study-statistical-analysis/

Work Cited

"Organizational Study: Statistical Analysis." IvyPanda, 18 May 2024, ivypanda.com/essays/organizational-study-statistical-analysis/.

References

IvyPanda. (2024) 'Organizational Study: Statistical Analysis'. 18 May.

References

IvyPanda. 2024. "Organizational Study: Statistical Analysis." May 18, 2024. https://ivypanda.com/essays/organizational-study-statistical-analysis/.

1. IvyPanda. "Organizational Study: Statistical Analysis." May 18, 2024. https://ivypanda.com/essays/organizational-study-statistical-analysis/.


Bibliography


IvyPanda. "Organizational Study: Statistical Analysis." May 18, 2024. https://ivypanda.com/essays/organizational-study-statistical-analysis/.

If, for any reason, you believe that this content should not be published on our website, please request its removal.
Updated:
This academic paper example has been carefully picked, checked and refined by our editorial team.
No AI was involved: only quilified experts contributed.
You are free to use it for the following purposes:
  • To find inspiration for your paper and overcome writer’s block
  • As a source of information (ensure proper referencing)
  • As a template for you assignment
Privacy Settings

IvyPanda uses cookies and similar technologies to enhance your experience, enabling functionalities such as:

  • Basic site functions
  • Ensuring secure, safe transactions
  • Secure account login
  • Remembering account, browser, and regional preferences
  • Remembering privacy and security settings
  • Analyzing site traffic and usage
  • Personalized search, content, and recommendations
  • Displaying relevant, targeted ads on and off IvyPanda

Please refer to IvyPanda's Cookies Policy and Privacy Policy for detailed information.

Required Cookies & Technologies
Always active

Certain technologies we use are essential for critical functions such as security and site integrity, account authentication, security and privacy preferences, internal site usage and maintenance data, and ensuring the site operates correctly for browsing and transactions.

Site Customization

Cookies and similar technologies are used to enhance your experience by:

  • Remembering general and regional preferences
  • Personalizing content, search, recommendations, and offers

Some functions, such as personalized recommendations, account preferences, or localization, may not work correctly without these technologies. For more details, please refer to IvyPanda's Cookies Policy.

Personalized Advertising

To enable personalized advertising (such as interest-based ads), we may share your data with our marketing and advertising partners using cookies and other technologies. These partners may have their own information collected about you. Turning off the personalized advertising setting won't stop you from seeing IvyPanda ads, but it may make the ads you see less relevant or more repetitive.

Personalized advertising may be considered a "sale" or "sharing" of the information under California and other state privacy laws, and you may have the right to opt out. Turning off personalized advertising allows you to exercise your right to opt out. Learn more in IvyPanda's Cookies Policy and Privacy Policy.

1 / 1