Introduction
Commonwealth Bank of Australia (CBA) provides retail financing, commercial and personal banking, corporate banking and marketplaces, asset management, and worldwide banking offerings. CBA was established in 1911, and its headquarters are in Sydney, Australia (Commonwealth Bank, 2022). The retail banking section serves store account holders and non-relationship-administered small businesses with mortgage payments (Commonwealth Bank, 2022). Enterprise and individualized finance provide customized banking solutions to partnership-managed businesses, personal banking to elevated persons, and leveraged borrowing and exchange via CommSec. Wealth management comprises Australian portfolio services, program governance, financial advising, and general and life assurance.
Performance Areas
The report uses three non-financial and four financial performance metrics to evaluate the effectiveness of CBA Bank. Non-financial performance measurements provide information about CBA’s success in non-monetary terms (Omran et al., 2021). Corporate governance, internal controls, and risk management techniques are the non-financial measures utilized by CBA to evaluate its success. The selection of these three measures above others is based on the fact that they create a set of policies and procedures that dictate how a business functions and how its investors’ interests are aligned (Gouiaa, 2018). CBA’s financial performance is determined by its assets, obligations, income, expenditures, ownership, and efficiency (Awaysheh et al., 2020). CBA uses profitability ratios, cash flow ratios, asset management, and debt management as financial measurements. These indicators were selected because they demonstrate how effectively a firm can garner value for its owners and offer a wealth of additional details compared to comparable firms’ findings.
Process of Analysis
A process for analysis is a continual improvement method in which enterprises study how they carry out operations to discover more effective ways to complete a particular task (Kharlamova et al., 2020). This examination considers the intake, procedure, and outcome of any transaction. The method for analyzing the non-financial and financial measures provided for contrast is detailed in this section. First, the report would gather as much data as conceivable from multiple websites and academic components on the non-monetary and financial indicators to be reviewed, as well as recognize the key players involved in the process, namely the CBA and the NAB.
Second, the metrics will be analyzed using information from the previously listed sources. This would be determined by analyzing a series of ratios on a firm’s income statement to assess the efficiency with which it creates shareholder value and earnings. For example, the gross profit margin reveals the disparity between receipts and product costs. If the CBA has a better gross profit margin than the NAB, this may be an encouraging indicator for the business. Finally, the analysis would conclude by comparing and drawing inferences from examining the tools utilized by the two companies.
The National Australia Bank (NAB) is utilized as a comparison as they operate in the same business segment. It offers financing, lending and debit account utilities, renting, residential and commercial banking, global commerce, corporate finance, asset administration, and curator and beneficiary functions (NAB, 2022). Using the non-financial and economic data of the National Australia Bank, the research will apply the institution’s numerous ratios to examine the firm’s ability and forecast the foreseeable trajectory of the stock price. In addition, CBA will be monitored using NAB data, which will offer an overview of CBA’s financial viability.
Analysis
Under this section, the report evaluates the financial and non-monetary metrics for both CBA and NAB organizations.
Financial Metrics
Profitability Ratios
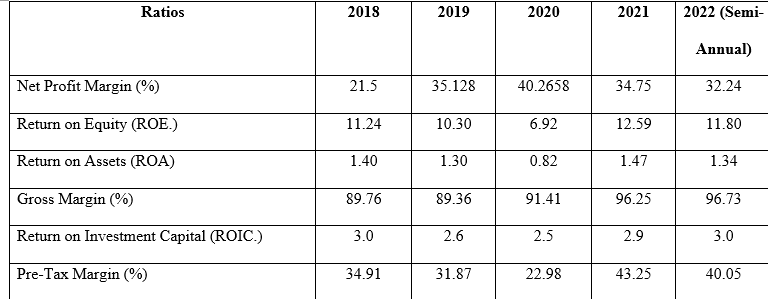
Table 1: CBA Profitability Ratios

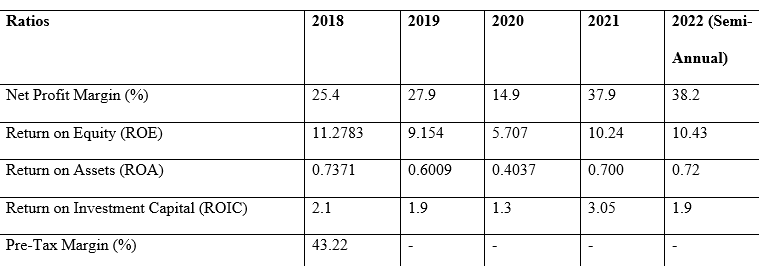
Table 2: NAB Profitability Ratios

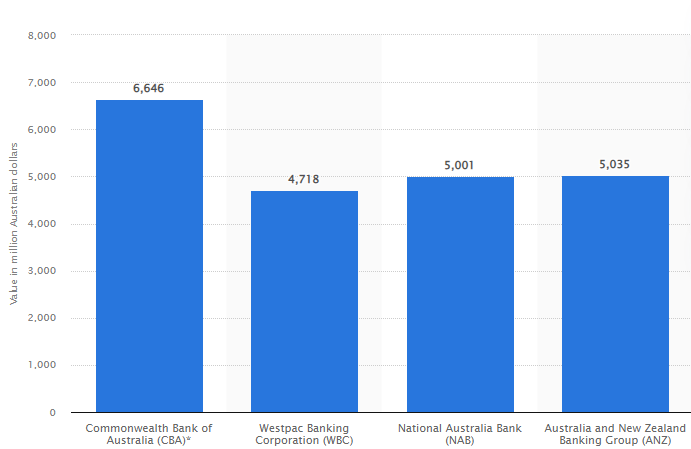
The above information from table 1 and 2 can be graphed as compared as illustrated in the following example.

Cash Flow Ratios
Table 3: CBA Cash Flow Ratios
Table 4: NAB Cash Flow Ratios
Using the information from table 3 and 4, CBA has had increasing operating cash flows for the five year period as compared to that of NAB.
Asset Management
Table 5: CBA Assets

Table 6: NAB Assets

From table 5 and 6, CBA has generally higher number of assets as compared to those of NAB.
Debt Management
Table 7: CBA Debt Management
Table 8: NAB Debt Management
From table 7 and 8, the debt-to-equity ratio of NAB is lower than that of CBA, indicating it is most preferred for investment.
Non-Financial Metrics
First, considering regulatory changes, shifting stakeholder interests, and the Group’s dynamic operating conditions, the CBA board routinely examines and revises its organizational governance mechanisms and processes. NAB has a rigorous standard for establishing and articulating its corporate governance practices and guidelines. It adheres to all pertinent laws and regulations, including the 2001 Corporations Act (Wsj.com, 2022b). Second, CBA examines possible hazards and appropriate controls for bribery and fraud danger zones such as presents, amusement, endorsements, contributions, and recruitment. NAB uses an internal-based approach to buyer background research encompassing online controls (Wsj.com, 2022b). Finally, to reduce whistleblower risks, NAB’s whistleblower policy ensures proper actions to deal with complaints, offering a forum for settlement. CBA’s technologies, processes, rules, operations, and personnel discover, analyze, assess, oversee, communicate, control, or reduce external and internal material risk through team management threat mechanisms.
Key Findings and Insights
First, comparing profitability rates such as ROE, an indicator of a company’s value and how efficiently it creates revenues (Husain and Sunardi, 2020), CBA earns more income from its equity investment than NAB. Therefore, the greater the ROA, the more effective a corporation is at creating profits. Thus, regardless of the fact that CBA’s ROA (1.34) is higher than NBAs (0.72), the smaller ROA suggests that the corporation is not producing a greater profit from its commercial operations. Second, the following conclusions have been drawn based on the cash flow ratios analysis. The operating cash flow proportion indicates the ease with which a firm’s current liabilities are serviced by its earnings. CBA’s operating cash flow rate of 89.16 suggests that it is liked by venture capitalists, lenders, and economists since it indicates that CBA can cover its present short-term obligations and yet generate profits. The identical situation applies to NAB, which has a more significant operating cash flow percentage.
Lastly, concerning debt management metrics, the following deduction is permissible. Due to the inherent riskiness of debt, financiers and investors favor enterprises with more negligible D/E levels. As a result, the NAB has a lesser D/E ratio (1.87), contrasted to the CBA’s of 2.075. For borrowers, a low ratio indicates a lesser chance of credit default; hence, NAB is favored. It reduces the likelihood of insolvency for owners in the case of an economic crisis. Since CBA’s percentage is more than the norm for its sector, it may have difficulties obtaining further capital from either source.
On the other hand, looking at the non-monetary performance indicators discussed in the analysis section, the following findings can be made. First, in terms of corporate governance, NAB has a more stringent standard for articulating and articulating its processes and policies than CBA. Second, both organizations have efficient internal control processes for their administration and management. CBA’s guidelines are crucial in directing the Group’s decision-making and behavior. In contrast, NAB’s securities fraud policies establish its accountability and hazard tolerance to discover, monitor, and reduce financial fraud opportunities across the firm. Finally, both organizations have robust risk management procedures to counteract internal and external threats. CBA’s business risk management approach encompasses the technologies, institutions, regulations, techniques, and individuals that discover, regulate, control, monitor, and mitigate internal and external sources of potential hazards. In contrast, NAB’s whistleblower strategy and initiative are included in its oversight and threat framework.
Conclusion
In conclusion, to meet and serve the objectives in the segments in which it operates, CBA must work on the insights provided in the report to remain the industry’s leader. First, CBA should strive to increase its ROA to higher desirable levels. A corporation can achieve a high ROA by increasing its profit margin or, more effectively, by utilizing its assets to generate sales (Abeyrathna and Priyadarshana, 2019). As a result, since CBA has a greater quantity of cash, liquid funds, and physical infrastructure as of 2022, it may decide to improve its ROA to make the company more attractive to investors. Second, CBA has a greater D/E ratio than NAB (2.075). To reduce the undesired D/E ratio, CBA can consider settling off loans, as this will cause the ratio to begin to equalize (Kurniawan, 2021). In addition, no money would be wasted if the enterprise’s inventory was well managed.
References List
Abeyrathna, SPGM and Priyadarshana, A.J.M. (2019) ‘Impact of firm size on profitability,’ International Journal of Scientific and Research Publications, 9(6), pp.561-564.
Awaysheh, et al. (2020) ‘On the relation between corporate social responsibility and financial performance,’ Strategic Management Journal, 41(6), pp.965-987.
Commonwealth Bank | Company Overview & News. (2022). Forbes. Web.
Gouiaa, R. (2018) ‘Analysis of the effect of corporate governance attributes on risk management practices. Risk Governance and Control: Financial Markets & Institutions, 8(1), pp.14-23.
Husain, T. and Sunardi, N. (2020) ‘Firm’s value prediction based on profitability ratios and dividend policy. Finance & Economics Review, 2(2), pp.13-26.
Kharlamova, et al. (2020) ‘Management accounting using benchmarking tools,’ Academy of Accounting and Financial Studies Journal, 24(2), pp.1-7.
Kurniawan, A. (2021) ‘Analysis of the effect of return on asset, debt to equity ratio, and total asset turnover on share return,’ Journal of Industrial Engineering & Management Research, 2(1), pp.64-72.
Macrotrends.net. (2022). First Commonwealth Financial Statements 2009-2022 | FCF. Web.
NAB – National Australia Bank | Company Overview & News. (2022). Forbes. Web.
Omran, et al. (2021) ‘Non-financial performance measures disclosure, quality strategy, and organizational financial performance: a mediating model,’ Total Quality Management & Business Excellence, 32(6), pp.652-675.
Statista. (2022). Australia: profit before tax of major banks 2022 | Statista. Web.
Wsj.com. (2022a). Commonwealth Bank of Australia. Web.
Wsj.com. (2022b). National Australia Bank Ltd. Web.
Wsj.com. (2022c). Commonwealth Bank of Australia. Web.
Wsj.com. (2022d). National Australia Bank Ltd. Web.