Introduction
Regulators, investors, tax authorities, and lenders are concerned differently with the performances of corporations. Over a period of time certain parameters have been developed that provide more or less useful and necessary information to almost all of the stated concerned sections. These generalized parameters have been used to assess the performance of ‘Johnson Matthey Plc.’, a listed company with London Stock Exchange. To pride an extra edge to the assessment figures of published accounts of ‘Teijin Ltd.’, also listed companies with LSE, have been used. JMP is a leader in catalysts for the generation of hydrogen and a strong position in other technologies. Both the companies are in the same ‘Chemical’ sectors. The performance assessment follows as under:
Profitability Analysis
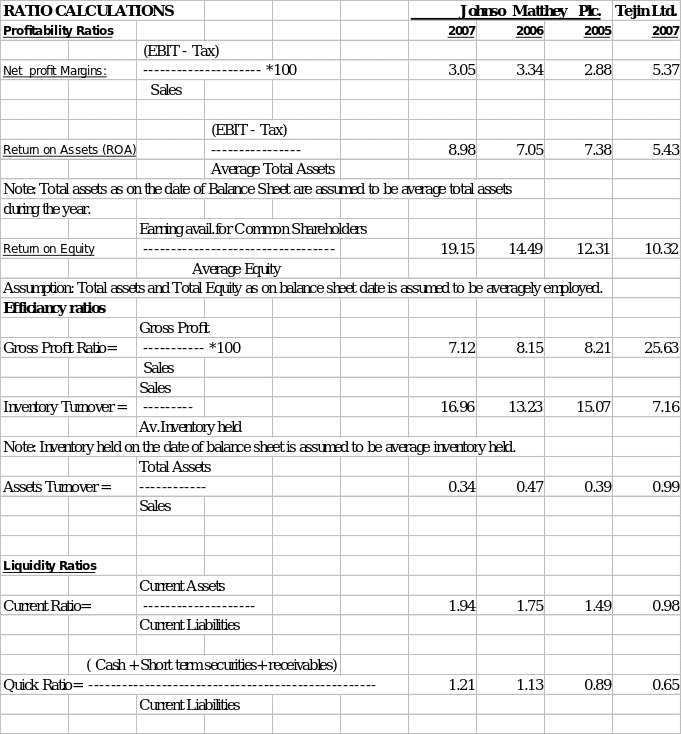
Ratio analysis is used to analyze the Profitability performance of Johnson Matthey Plc.(JMP). The ratios used are Net Margins, Return on assets (ROA), and Return on Equity (ROE).
Net margins of JMP in 2007 have been reduced to 3.05 when compared to 3.34 in 2006. However, year 2005 witnessed as low as 2.88. The reason for decline in 2007 is the huge stride taken by JMC in revenue enhancement. Revenue increased by 34.5% when compared to 2006 and reduction in net margins for 2007 are natural effects of such increase.
JMP is utilizing its assets in a very effective manner. ROA has gone up to 8.98 in 2007 from 7.05 in 2006, and this is certainly is a great achievement despite the fact that there were depletion of fixed assets to the tune of 74.9m during the year.
JMP is performing very well on account of its return on equities. ROE has gone up to 19.15 in 2007 from 14.49 in 2006 and 12.31 in 2005. This is certainly a progressive approach with well planned strategy. It appears the planning is with an eye on next issue of JMP.
Comparative data of another company in the industry, namely Teijin Ltd. for the year 2007 are Net margins (5.37), ROA (5.43), and ROE (10.32). This shows that even in the industry JMP is performing better than giant Teijin ltd.when comparison is made on account of total assets and total equity at the disposal of each company.
On all these three counts of profitability, JMP is performing fairly well in the industry.
Efficiency
The ratios chosen to assess the efficiency into the working of JMP are Gross Profit, inventory turnover, and assets turnover. Gross Profits margins measures the percentage of each pound or dollar of sales remaining after the cost of goods sold.
Gross profit covers other overheads and contributes towards net margins. JMP’s gross margin performance is not as bright as it should have been considering the net margins of others in the industry. The gross margin in 2007 is 7.12% of sales, whereas the other leading organization Teijin Ltd. is earning a gross profit ratio of 25.63%. Of course, no direct comparison is possible unless product line is absolutely similar in nature. JMP’s gross margins have come down to 7.12% in 2007 from 8.15% in 2006 and 8.21% in 2005. One of the factors responsible for such decline is the increase in revenue from 4573.7m in 2006 to 6151.7m in 2007.
Inventory turnover of any company measures the activity, or liquidity, of a company’s inventory. JMP’s inventory turnover is 16.96 in 2007 (or dividing it into 360 it can be converted into average age of inventory).Accordingly in 2007 this age is 21.22 days as compared to 27.21 days in 2006 and 23.88 days in 2005.Accordingly the performance in 2007 has improved over the last two years as the lesser the number of days inventory is held by the firm the better it is. Teijin Ltd. Has held inventory on an average for 50.27 days and that certainly is not an appreciable performance.
Total assets turnover indicates the efficiency with which the company is using its assets. Higher turnover indicates better performance. JMP has this turnover of 0.34 in 2007 as compared to 0.47 in 2006 and 0.39 in 2005. JMP has certainly not done better in 2007 and need improvements in exploiting assts. Teijin Ltd.’s performance at 0.99 is much better than JMP.
Liquidity
In any industry a current ratio of 2.0 is occasionally cited as acceptable, but a value’s acceptability depends on the industry in which the company operates. From this point of JMP has progressively performed well. Current ratio has improved from 0.89 in 2005 to 1.13 in 2006 and finally settled at 1.94 in 2007. That means it will generally be easy for JMP to meet its short term obligations when those become due. On the other hand current ratio of Teijin Ltd. is much below the standard of 2.0. The net working capital of JMP is also more than 1.0 as whenever the current ratio is 1.0 the firm’s net working capital is zero. A positive net working capital is good sign for the firm to meet its current obligations.
Quick ratio is part of current ratio. The only difference is that inventory is not included into the calculations of quick ratio, as it involve cash and near cash current assets for the purpose. JMP has performed well on this count as well. Quick ratio in 2007 is 1.21 as compared to 0.89 in 2006 and 0.65 in 2005. A quick ratio of 1.0 or greater is occasionally recommended but an acceptable value depends upon the industry. Teijin Ltd.’s quick ratio 0.65 in 2007 is not at all impressive.
Liquidity wise JMP is a strong company. It is ready to meet any eventuality of short term obligation
Gearing or leverage of Capital Structure
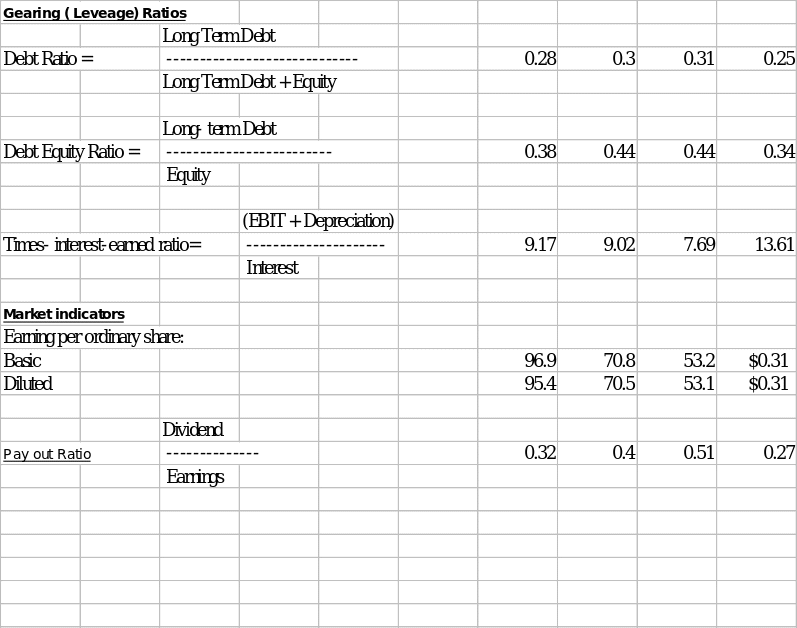
Capital gearing of capital structure of a company (i.e., the mix of long term debt and equity maintained by the company) can significantly affect its value by affecting return and risk. Gearing is also called leverage. Debt ratio measures the degree of indebtedness and accordingly the degree of gearing. The higher the debt ratio, the higher is firm’s leverage or gearing and vice versa. From the calculations in the annexure debt ratio of JMP is 0.28 in 2007, 0.3 in 2006 and 0.25 in 2005. That means JMP is a low geared company all along and does not believe in gearing through debt capital. Equity holders are not taking the risks of fixed payments of debt capital and therefore they should not expect higher returns associated with the risk involved. The trend in industry is same as of JMP. Tejin Ltd. is also a low geared company with its debt ratio at 0.25.
Measure of the company’s ability to meet fixed interest payments on long term debts can be judged through ‘Times Interest Earned Ratio’ The smaller the ratio, the less is the company’s ability to meet long term interest obligations as they become due. JMP has this ratio described as 9.17 times of interest on long term debts in 2007, and that appears to be reasonable situation. In 2006 it was 9.02 times and in 2005 the comfort level was low at 7.69 times. Tejin Ltd.has this ratio at 13.61 times the interest on long term debts in the year 2007 and that is better than JMP. As both companies are low geared, it appears that industry believes in equity investments and does not play the game of gearing of the capital structure.
Investors’ attractions
Basically investors are interested in two ratios, i.e., earning per share and dividend payouts. “Earning per share is a traditional method used for determining corporate value”. This certainly is a matter of attraction to present and prospective shareholders. JMP has been showing a fantastic EPS, both basic and diluted. Its basic EPS in 2007 is pound 96.91 as compared to 70.8 and 53.2 respectively in 2006 and 2005. The same is the situation with diluted EPS. It was 95.4, 70.5, and 53.1 in 2007, 2006 and 2005 respectively. So attractive is EPS that JMP is bound to be over subscribed in its next effort of going public. Tejin Ltd. has very low EPS at $0.312 (basic) and $ 0.31(diluted) in 2007.
Dividend payout may be based on a policy that may be constant, or regular, or low –regular-and –extra dividend. Whatever may the policy adopted by the company, the investors are basically concerned with actual dividend received by them. Without going in depth into policy matters, the dividend payout of JMP has been very attractive so far, even though the payout is declining year by year. It declined from 0.51 in 2005 to 0.4 in 2006 and to 0.32 in 2007. It is still attractive comparing 0.27 of Tejin Ltd in 2007.
In nutshell JMP has definitely adopted a policy to keep attracted investors of equity; and it has not shown any risk taking initiative through capital gearing of the capital structure of the company.
Conclusion
Johnson Matthey Plc. is performing well though its net margin has sliced a little due to turnover increment in 2007. Liquidity wise the company will meet all its obligations when due. Though its assets remain underutilized, still the company is performing very well for investors with a very good EPS and dividend payout policy.
References
Earning per share (EPS), 12 Manage Management Communities.
ANNEXURE

