Picket Fence Free Fall Analysis Report

Exclusively available on Available only on IvyPanda® Written by Human No AI

Introduction

The present laboratory work investigates the relationship between the velocity of a picket fence falling at constant acceleration and the instantaneous value of the time it takes for this fall. Four tests were performed to collect data in which the picket fence is released in vertical free fall against a photogate, the passage of the black strokes recorded automatically. As a result of these tests, Table 1 was constructed, reflecting the time taken to pass a particular path.

Table 1: Raw data from four measurements

Run #1Run #2Run #3Run #4
Time (sec.) ±0.0001Position (m) ±0.005Time (sec.) ±0.0001Position (m) ±0.005Time (sec.) ±0.0001Position (m) ±0.005Time (sec.) ±0.0001Position (m) ±0.005
0.61000.0000.71000.0000.63000.0000.53000.000
0.66000.0500.75000.0500.67000.0500.58000.050
0.70000.1000.79000.1000.71000.1000.61000.100
0.73000.1500.81000.1500.73000.1500.64000.150
0.75000.2000.84000.2000.76000.2000.66000.200
0.78000.2500.86000.2500.78000.2500.68000.250
0.80000.3000.88000.3000.80000.3000.70000.300

Analysis

For each of the four tests, it was necessary to determine the instantaneous values of time and velocity. The corresponding mean values were calculated according to the formulas given in the textbook — [1] and [2] — for the pairs of each of the seven positions (from 0.000 m to 0.300 m) and entered in Table 2.

Results of the performed calculations with an indication of the calculation strategy
Table 2: Results of the performed calculations with an indication of the calculation strategy.

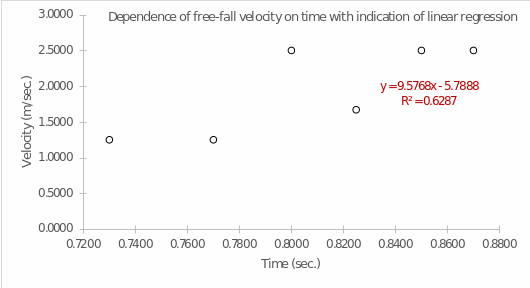
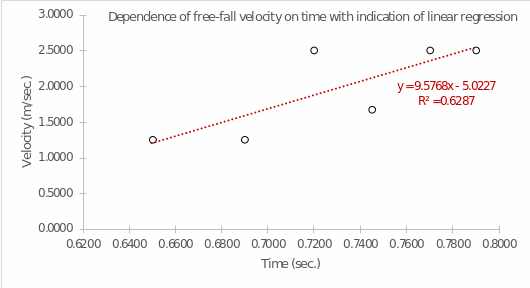
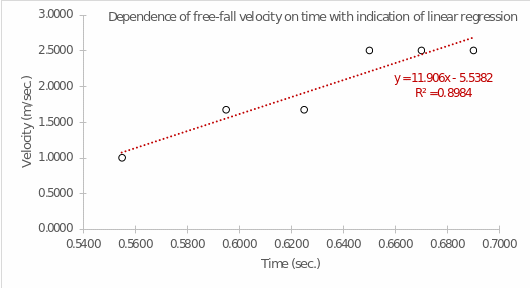
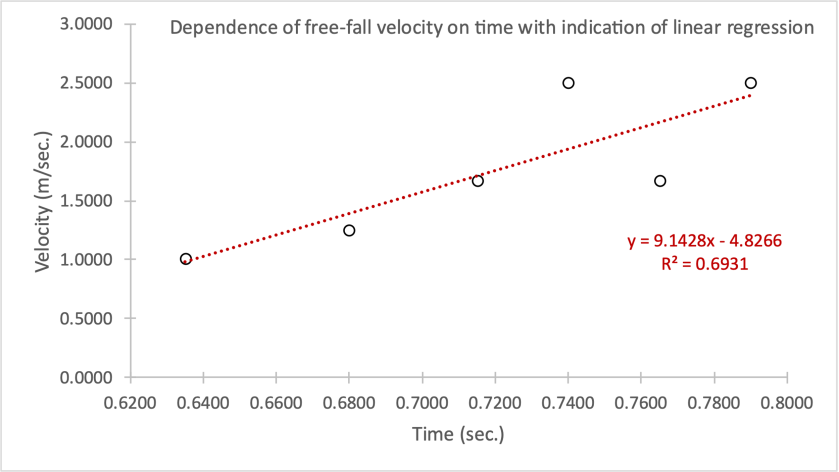
From the last two columns for each section of Table 2, it was necessary to plot the linear dependence: a total of four graphs. The corresponding visualizations showing the linear regression equation are shown in Figures 1-4.

Formula

Linear dependence plot of the picket fence fall rate on the instantaneous value of time
Figure 1: Linear dependence plot of the picket fence fall rate on the instantaneous value of time (first test)
Linear dependence plot of the picket fence drop rate on the instantaneous value of time
Figure 2: Linear dependence plot of the picket fence drop rate on the instantaneous value of time (second test)
Linear dependence plot of the picket fence fall rate on the instantaneous value of time
Figure 3: Linear dependence plot of the picket fence fall rate on the instantaneous value of time (third test)
Linear dependence plot of picket fence fall speed on instantaneous time value
Figure 4: Linear dependence plot of picket fence fall speed on instantaneous time value (fourth test)

As can be seen, each regression has a different value of the coefficient of determination. The R2 coefficient determines the accuracy of the model fit: out of all four plots, the highest accuracy was true for the fourth trial, in which the regression covered up to 89.84% of the variance of the data (Fernando, 2021). The resulting equations indicate a nearly linear relationship between the variables: as time increases, so does the rate. This means that the velocity would be infinite in the perspective of unlimited fall, which is consistent with the physical meaning of acceleration. For each graph, there is a unique value for the slope coefficient, which is the rate of acceleration (m/s2) as the time parameter increases by one unit. Although all the slopes are similar, the velocity for the fourth trial changed the most. At the same time, the y-intercept values determine the speed of fall (m/sec) of the picket fence at zero time when the object has not yet committed motion. For all graphs, these values are negative, but in practice, this does not make sense because, at the zero moment of time, the objects had no velocity in this reference frame.

Conclusion

To summarize, in this laboratory work, the relationship between the velocity of fall and time was studied. It was shown that the models could be treated as linear with a sure accuracy; the equations of the corresponding linear regressions reflecting the reciprocal relationship are presented. The slope in the regression equation corresponds to the free-fall acceleration acting on the falling object. In physics, this coefficient has a value of 9.8, and the laboratory-calculated values are close to this parameter, except for the fourth test.

Reference

Fernando, J. (2021). Investopedia.

Cite This paper
You're welcome to use this sample in your assignment. Be sure to cite it correctly

Reference

IvyPanda. (2023, May 26). Picket Fence Free Fall Analysis. https://ivypanda.com/essays/picket-fence-free-fall-analysis/

Work Cited

"Picket Fence Free Fall Analysis." IvyPanda, 26 May 2023, ivypanda.com/essays/picket-fence-free-fall-analysis/.

References

IvyPanda. (2023) 'Picket Fence Free Fall Analysis'. 26 May.

References

IvyPanda. 2023. "Picket Fence Free Fall Analysis." May 26, 2023. https://ivypanda.com/essays/picket-fence-free-fall-analysis/.

1. IvyPanda. "Picket Fence Free Fall Analysis." May 26, 2023. https://ivypanda.com/essays/picket-fence-free-fall-analysis/.


Bibliography


IvyPanda. "Picket Fence Free Fall Analysis." May 26, 2023. https://ivypanda.com/essays/picket-fence-free-fall-analysis/.

If, for any reason, you believe that this content should not be published on our website, you can request its removal.
Updated:
This academic paper example has been carefully picked, checked, and refined by our editorial team.
No AI was involved: only qualified experts contributed.
You are free to use it for the following purposes:
  • To find inspiration for your paper and overcome writer’s block
  • As a source of information (ensure proper referencing)
  • As a template for your assignment
1 / 1