Introduction
Plants require nutrients in the form of proteins, carbohydrates, lipids and nucleic acids from the environment. These nutrients are obtained from the soil through absorption via the roots or directly from the air (by the stomata) (Casal et al. 310). The nutrients obtained by the plant are used in the growth and development of various plant parts. For instance, the shoots require adequate nutrients because they are involved in the important function of photosynthesis, which leads to the formation of sugars that are stored in the form of starch and cellulose (Noguera et al. 1018). Thus, plants have mechanisms of regulating the distribution of nutrients and biomass to various parts of the plant. Consequently, the rate of growth and development of plants differ from one species to another based on the inherent resource allocation strategy that is used by the plant (Xie et al. 258).
Additionally, plants adapt differently to their environmental conditions, which in turn affect the distribution of resources to various parts. According to Yang et al. (62), resource allocation is influenced by the environmental conditions of the plant in some species while in other species the allocation is genetically determined. For example, plants that grow in dry areas channel their resources towards the development of a thick, waxy cuticle to restrict the loss of water to the environment via evapotranspiration. Other plants may direct their resources towards the development of long, deep roots to facilitate the absorption of water and mineral salts.
The aim of this study was to determine the resource allocation strategies between plant species as well as within a given species growing in different abiotic conditions. The comparisons were to be made by quantifying the root and shoot biomasses and expressing them as root to shoot ratios. It was hypothesized that there was no significant variation in length and weight R:S ratios of different plants in various nutrient concentrations.
Materials and Methods
Plants were planted in vermiculite (a soil-less medium containing a few minerals) in trays and supplemented with 1X standard fertilizer while others in fertilizer diluted to one-tenth the normal concentration (0.1X). The plants were harvested by gently pulling them from the tray and rinsed using water to remove the vermiculite and separate the roots. The roots were dried with a paper towel after which the lengths of the roots and shoots were measured to the nearest millimeters. The data collected were recorded in an Excel spreadsheet. The height and weight of big plants such as beans were measured for a single plant while for smaller plants such as rye and alfalfa, the measurements were taken for a group of ten plants. On the other hand, for medium-sized plants such as oats and radish, measurements were taken from a group of five plants and the average was used instead. The recorded data were converted into data tables and used to plot graphs.
The roots were separated from the shoots by cutting each plant apart at the soil line, which was the original level of the vermiculite. The weights of the roots and shoots were then taken separately. For the group measurements, the weights of the five or ten plants were measured and recorded as total weight. The weight of the individual plants was then calculated by dividing the total weight by the number of roots.
Results
Table 1A: Individual Root: Shoot Ratios for Each of the Three Replicates.
Table 2: Summary Class data.
Questions
- The group hypothesis was that there was no significant variation in length and weight R:S ratios of different plants in various nutrient concentrations.
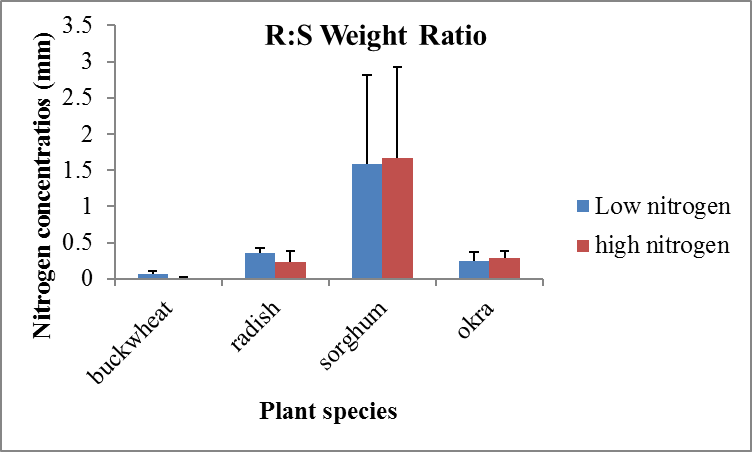
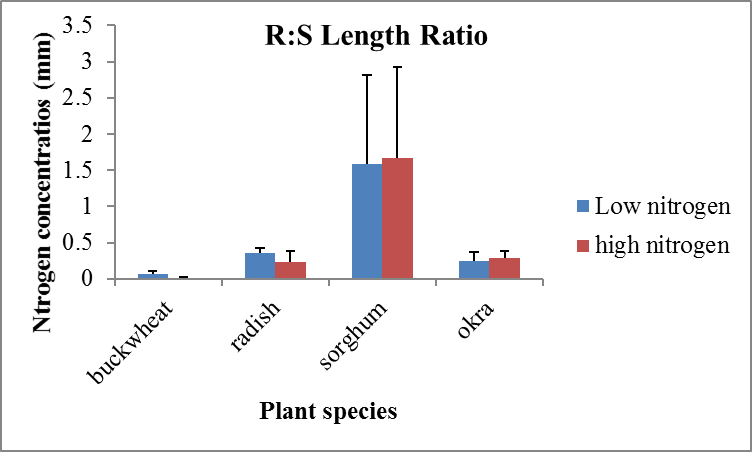
- Graphs:


- The collected data did not support the initial hypothesis. It was observed that overall, an increase in nutrients led to an increase in the root: shoot ratio. Conversely, a decrease in nutrients led to a decrease in the root to shoot ratios for the length and weight.
- There was no pattern in how the allocation of resources changes with the amount of nitrogen available. In some plants such as buckwheat, sorghum and okra, an increase in nitrogen concentrations led to an increase in the R:S ratio. However, in radish, an increase in nitrogen levels led to a decrease in the R:S ratio.
- Large differences in R:S ratio between the two nutrient treatments indicated a high rate of phenotypic plasticity. Other types of environmental conditions that would favor plants with high phenotypic plasticity include shade tolerance, light, and water. Shade tolerance depicts the least light intensity that enables the survival of a plant. Light, on the other hand, influences the rate of photosynthesis of a plant. The ability to adjust to various light intensities enables a plant to survive in varying light intensities. A plant with high phenotypic plasticity would survive under varying water conditions because it would allocate its resources to the roots or shoots according to the prevailing water conditions (Richards et al. 982).
- Apart from nutrients and light, other factors that might affect the root to shoot ratio in plants include water, soil and carbon dioxide.
- When the nitrogen level was reduced, there were no species where the R: S weight ratio changed, but the R:S length ratio did not. Also, there were no species where the R:S length ratio changed, but the weight ratio did not. These observations could be attributed to the uniform allocation of resources within a given plant, which was probably due to genetic differences within various species.
- The plant with a low root: shoot ratio would do well in a forest. The low root to shoot ratio would enable the plant to allocate its resources to the leaves and shoots to increase the rate of photosynthesis. Consequently, the elevated rate of photosynthesis would provide the raw materials necessary for the synthesis of raw materials for the synthesis of other building blocks needed by the cell. As a result, the plant would grow tall and compete with other plants for light.
Conclusion
From the experiment, it was concluded that plants adapt according to the available resources by allocating the available reserves to different plant parts. However, the manner of resource allocation was influenced by the inherent traits of a given plant species.
Works Cited
Casal, Jorge J., Christian Fankhauser, George Coupland, and Miguel A. Blázquez. “Signalling for Developmental Plasticity.” Trends in Plant Science 9.6(2004): 309-314. Print.
Noguera, Diana, Marco Rondón, Kam-Rigne Laossi, Valerio Hoyos, Patrick Lavelle, Maria Helena Cruz de Carvalho, and Sébastien Barot. “Contrasted Effect of Biochar and Earthworms on Rice Growth and Resource Allocation in Different Soils.” Soil Biology and Biochemistry 42.7 (2010): 1017-1027. Print.
Richards, Christina L., Oliver Bossdorf, Norris, Z. Muth, Jessica Gurevitch, and Massimo Pigliucci. “Jack of All Trades, Master of Some? On the Role of Phenotypic Plasticity in Plant Invasions.” Ecology Letters 9.8 (2006): 981-993. Print.
Xie, Yonghong, Mingzhang Wen, Dan Yu, and Yongke Li. “Growth and Resource Allocation of Water Hyacinth as Affected by Gradually Increasing Nutrient Concentrations.” Aquatic Botany 79.3 (2004): 257–266. Print.
Yang, Zongjian, and David J. Midmore. “Modelling plant resource allocation and growth partitioning in response to environmental heterogeneity.” Ecological Modelling 181.1 (2005): 59-77. Print.