Pressure Drop Models
Juda and Chrosciel’s Model
Juda and Chrosciel (1970) applied the established association to determine the pressure drop that occurs in a virgin filter using the following equation.
ΔP = 4 μ Ʋf z  (Equation 2.1)
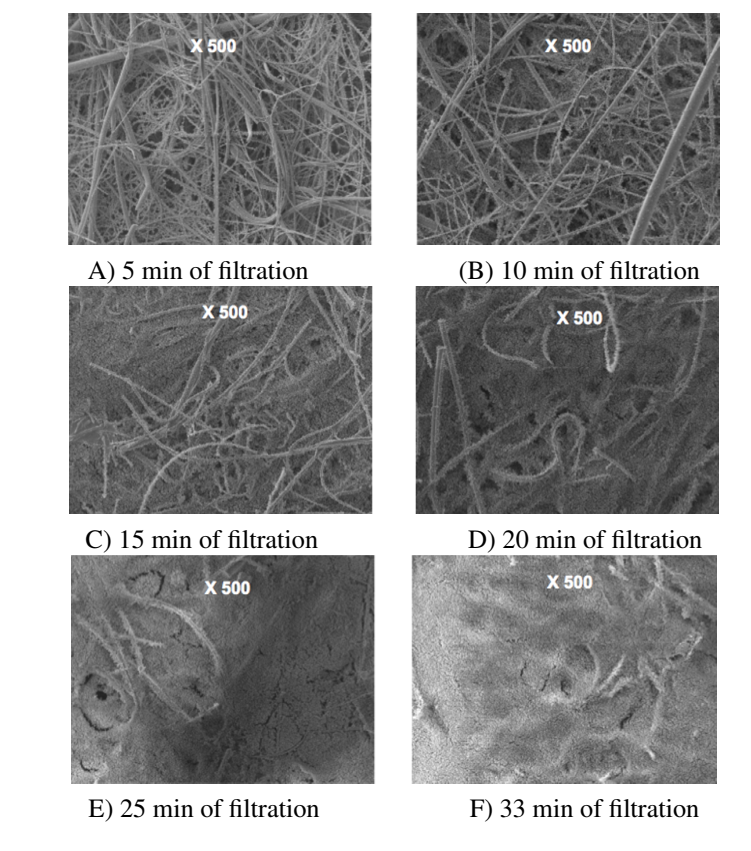
Where ΔP represents a change in pressure and C1 represents a constant (3/4) (Fuchs & Stechkina 1963; Greenspan 1977). The above equation assumes the distribution of particles is uniform in the filter as shown in figure 2.1.
Juda and Chrosciel (1970) used a model of a filtration fiber to elucidate the deposition of particles.
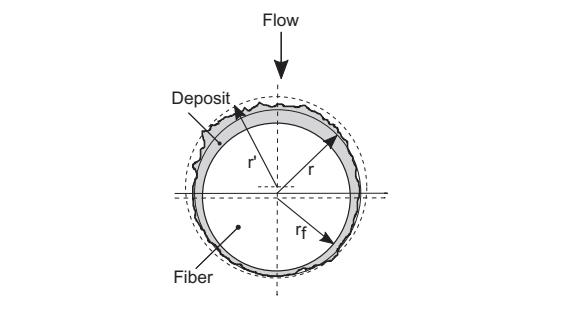
According to the model, two parameters describe the occurrence of deposition on the fiber.
- –r’ is the hydrodynamic radius encapsulated by deposit of particles.
- –r is the geometric radius of the fiber.
Juda and Chrosciel 1970) formulated the following equation to describe pressure drop across the filter.

Extension of Davies’ Model
Davies (1973) formulated a general expression that applies to a virgin filter. The expression considered that the particles trapped in the filter media have two effects, namely, increase the diameter of the fibers, and amplify the packing density of the filter (Yu, Bridgwater & Burbidge 1997; Wise et al. 2008). Therefore, the sum of packing density of particles captured in the fibrous media (????p) and the packing density of the virgin filter (????f) constitute a new packing density of the filter (Walsh 1996; Sakano et al. 2000). The expression [(1+αp/αf)1/2 df ] describes the new mean of the fiber diameter that associates with the capture of particles. Therefore, the following is the final expression that summarizes the calculation of pressure drop.
ΔP =64μDf(Equation 2.3)
The model assumes that the particle sizes are the same and their distribution in the filter is homogenous.
Bergman’s Model
According to Berman et al. (1978), clogged filter as a media that comprises of two collectors, namely, the first fibers of the filter and the captured particles in the form of dendrites. This model involves the determination of the pressure drop of a filter made from dendrites (ΔPp) and the addition of pressure drop of a virgin filter (ΔP0) (Kirsch 1998; Hettkamp, Kasper & Meyer 2012). The following expression illustrates the sum of pressure drop across a virgin filter and a hypothetical filter with dendrites.
ΔP = ΔP0 + ΔPp (Equation 2.4)
This model assumes that pressure drops of a virgin filter and a hypothetical filter are independent. Nevertheless, the influence of the fibers and the dendrites on the flow of particles is not negligible in an empirical sense. To consider the influence, Berman et al. (1978) enhanced the packing density of the dendrites and the fibers using specific constants. The packing density of the dendrites was increased by (Lf + Lp)/Lp, while that of the fibers was increased by (Lf + Lp)/Lf. In this case, Lp represents the whole length of dendrites in a given unit area, whereas Lf represents the overall length of the fibers.
Lf =4αfZ/πd²f (Equation 2.5)
Lp =4αp Z/πd²f(Equation 2.6)
The expression established by Davies (1973) facilitates the determination of the pressure drop across the dendrites and the virgin filters by ignoring the constant (1 + 56????3). Therefore, the following expression calculates the packing density of both dendrites and virgin filters per unit area.
ΔP = 16 π μ Df Lα1/2 (Equation 2.7)
In a clogged filter, the expression below describes the pressure drop across the filter.

Further simplification of the equation (2.8) by replacing Lp and Lf in equations 5.5 and 5.6 provides this equation (2.9).

This model is accurate in resolving pressure drop across filters because it does not only assume the existence of a homogeneous distribution of particles, but it also considers the average sizes of the captured particles.
Letourneau’s Model
The findings of Letourneau and Mulcey (1990) differed from those of Bergman et al. (1978), resulting in the modification of the model of pressure drop in filtration experiments. As per their finding, Letourneau and Mulcey (1990) rejected the assumption of homogeneity in the distribution of particles, but it considered the influence of the penetration ability of the particles. The analysis of the structure of the filter shows that it comprises of numerous layers with a specific thickness (dz), which gives a constant packing density of particles (αp) for each layer within a specific duration of filtration. Hence, the integration of Bergman’s model into the new model that considers the thickness of the filter and the packing density generates the following equation.

When there is a decline in the distribution of aerosol in the filter media, it is feasible to formulate an expression that defines αp (x) using the area density of captured particles (m/Ω as shown below.

In this equation, k represents the penetration factor of the filtration media. The combination of two equations (2.10 and 2.11) after transforming them through z-integration describes the pressure drop as shown below.
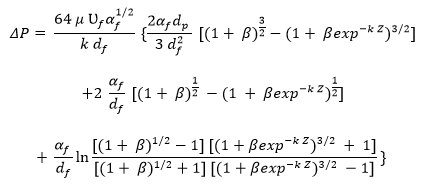
Where β emanates from the following expression.

Demonstration of this model with particles (submicronic uranine with 0.15 μm diameter and mass of 1.6g) proved that the model elucidates changes in pressure drop across filter with a high-efficiency in the state of deep clogging (Saleh et al. 2014). The application of this model relies on the penetration factor of particles into the filter. Moreover, the challenge with this model is that it does not consider the difference in the mean diameter of capture particles per unit thickness of filter media and the deviation of the penetration factor in the state of clogging. However, this model is reliable in measuring pressure drop because it assumes that the mean diameter is constant and the same as that of monodisperse aerosol.
Letourneau, Renaudin, and Vendel (1992) improved this model by incorporating the penetration factor obtained from efficiency models. The estimation of the penetration entailed the determination of pressure drop that corresponds to packing density of each filter per unit area expressed in equation 2.12 and deriving fiber diameter from the equation 2.3. Letourneau, Renaudin, and Vendel (1992) employed this approach to perform a series of calculations that allowed them to establish favorable value.
Kanaoka and Hiragi’s Model
In creating their model, Kanaoka and Hiragi (1990) commenced with the premise that there is no homogenous accumulation of particles on the fibers (Figure 2.5). This premise led to the modification of the drag coefficient of the fibers to reflect the random distribution of particles.
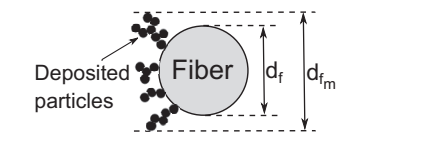
Based on the premise, Kanaoka and Hiragi (1990) formulated an equation that describes the pressure drop in clogged filters.

Where CT is the drag coefficient for virgin filters, CTm (z,t) is the drag constant for fibers clogged with particles, and dfm (z,t) is the diameter of the fiber clogged with particles.
Further development of their model resulted in expressions of Kanaoka and Hiragi (1990), which connects the ratio ( ![]() ) to the volume of the capture particles (dimensionless volume Vc)
) to the volume of the capture particles (dimensionless volume Vc)
![]()
In this equation, mLF is the coefficient that represents the mass of captured particles in every unit length of the fiber.
In instances where the dimensionless volume of capture particles is less than 0.05, the following expression applies.
![]()
However, in instances where the dimensionless volume of captured particles is more than 0.05, the following expression applies.
![]() + c)
+ c)
In the equation, the values of a, b, and c represent experimental constants derived from clogged filters.
The ratio of dimensionless volume represents the drag coefficient ( ![]() ) of clogged fibers with varied diameters. This model applies in filters made of metallic fiber with a diameter ranging from 24 to 30 μm, clogged with an aerosol of methylene blue with a mean diameter of 0.8-0.84 μm or Rhodamine B aerosol with a mean diameter of 0.33 μm, and placed to intercept the flow of particles. Nevertheless, this model does not agree fully with that real fibrous media (Jaganathan, Tafreshi & Pourdeyhimi 2008).
) of clogged fibers with varied diameters. This model applies in filters made of metallic fiber with a diameter ranging from 24 to 30 μm, clogged with an aerosol of methylene blue with a mean diameter of 0.8-0.84 μm or Rhodamine B aerosol with a mean diameter of 0.33 μm, and placed to intercept the flow of particles. Nevertheless, this model does not agree fully with that real fibrous media (Jaganathan, Tafreshi & Pourdeyhimi 2008).
Kanaoka and Hiragi (1990) attribute the apparent variation to the existence of the non-homogenous distribution and the tri-dimensional structure of the fibers. In their findings, Kanaoka and Hiragi (1990) point out that this model applies in instances where the mass of capture particles and the diameter of the fibers are definite. Therefore, the inability to determine masses of particles and diameters of fibers limits the analytical application of the model.
Full Models
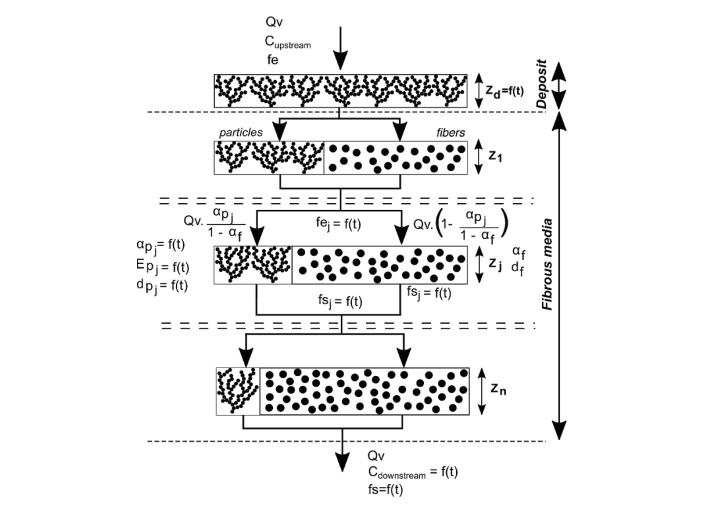
A literature review of the evolution of a simple analytic model with the ability to describe the pressure drop across three phases of the filtration process is lacking. Surface filtration and depth filtration are the first two phases that expound the occurrence of pressure drop, as Figure 3.4 illustrates.
The Thomas Model
Thomas et al. (2001) designed a model that applies to submicronic particles and high-efficiency filters. This model is complicated because it comprises of various sections with two forms of collectors in each section. Fibers and dendritic form of captured fibers are the two forms of collectors that are present. This model determines the pressure drop based on the mass of particles collected on fibers and those collected by deposited particles.
Moreover, the application of Bergman’s equation (2.9) aids in the determination of pressure drop across the filter. When the packing density of the transition layer is equal to that of the first layer, particles start to deposit on themselves to form a cake (Thomas et al. 2001; Schmidt & Loeffler 1991). The formation of cake enhances the efficiency of the filter because it aids in the capture of additional particles.
Following the formation of the cake, Novick’s equation makes it possible to calculate the pressure drop by integrating the expression of the packing density. The method of calculation considers thickness, packing density, average diameter, and other attributes of the fibers. Additionally, the method considers the operating conditions (velocity) and attributes of the aerosol such as density of particles, standard deviation, and mean diameter).
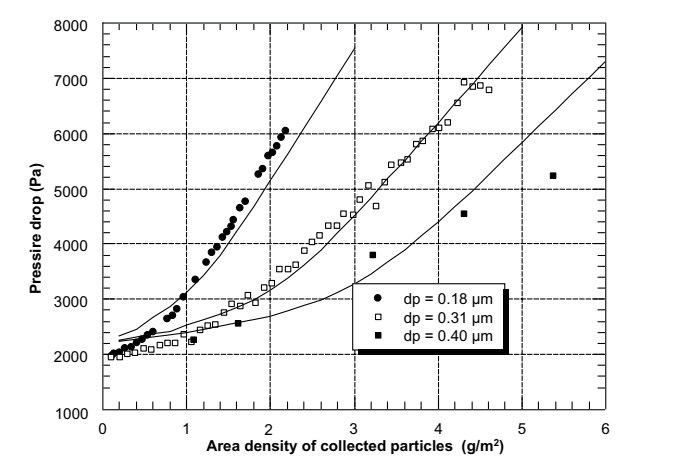
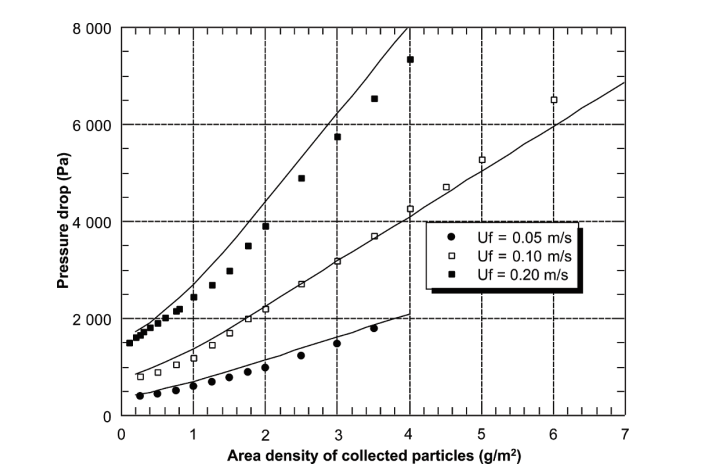
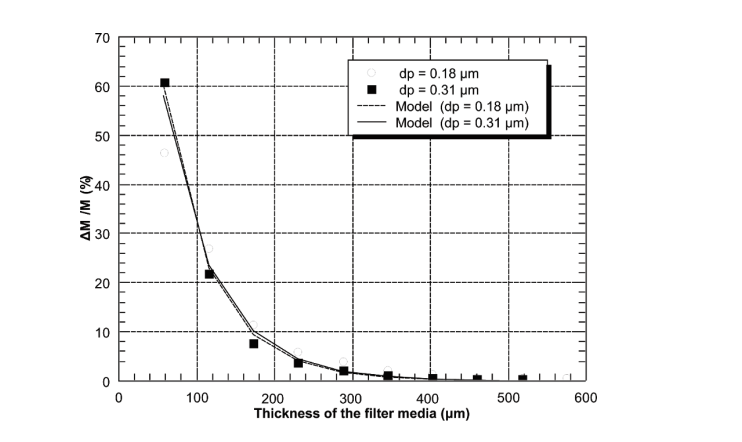
Figures 2.5 and 2.6 demonstrate the occurrence of pressure drop in the transition zone and the depth filtration surface during clogging. Additionally, Figure 2.7 describes the penetration profile of particles within the filter media effectively. Nonetheless, regardless of the model employed, the calculation method does not describe the penetration efficiency of filters during clogging (Kasper, Schollmeier & Meyer 2010). In describing the deposition of submicronic particles, Thomas et al. (2001) support the model developed by Payet et al. (1992) because it gives accurate outcomes of efficiency despite its tendency to overestimate.
Bourrous Model
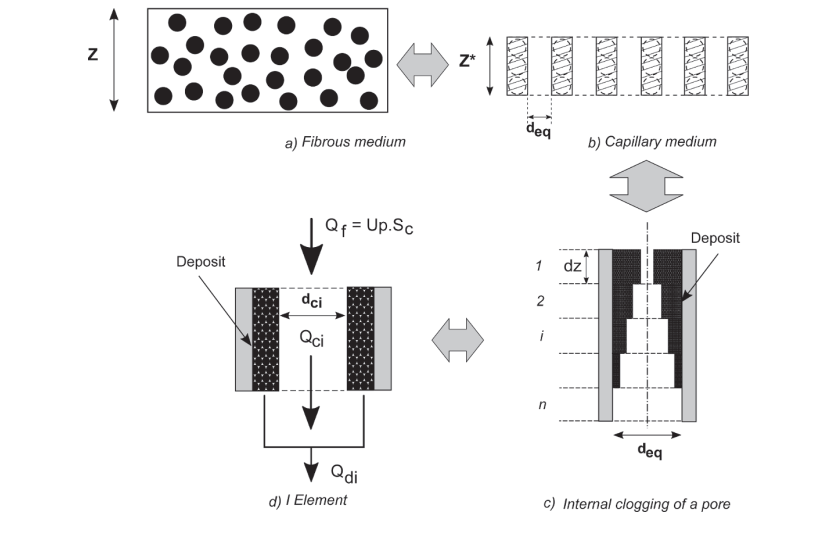
In describing the behavior of fine particles, Buourrous et al. (2016) adopted the strategy explicated by Elmoe et al. (2009) and Elmoe, Tricoli, and Grunwaldt (2011), which entails the reduction of the diameter of pores in filters. In their work, authors compared how the capillary network and the fibrous medium (Figure 3.8) function in the same area and the level of pressure drop (Bourrous et al. 2014; Bourrous et al. 2016). The following expression gives the thickness (Z*) of the capillary network.
Z* = αZ
Poiseuille’s equation (Liu et al. 2016) estimates the pressure drop across pores in the laminar flow setup.
![]()
By considering that the interstitial velocity is the same as the flow velocity in pores, the following expression provides the determination of the pore diameter (deq).
deq= ![]()
In this equation, ???? and Z are coefficients that represent packing density and the thickness of the fibrous media respectively.
The advancement of the pressure drop in both the fibrous medium and the capillary medium, which causes the capillary diameter to shrink, is similar to the pressure drop associated with clogged pores. During the phase of the depth clogging, the penetration profile of aerosol in the fibrous media requires consideration of pores. In this view, a subdivision of pores into layers, according to their thickness (dz) (Figure 3.9c) and varying extent of clogging, is essential in the determination of pressure drop. Figure 3.9d indicates that the proportion of volumetric flow rate happens in the porous deposit (????p) and another proportion occurs in the free flow zone (dci) (Fowler & Hertel 1940). Consideration of these proportions shows that it is feasible to calculate Qdi and Qci using the following equations.
Qf =Qdi+Qci (Equation 2.19)
The pressure drop is:

The models designed by Thomas et al. (2014) and Kozeny-Carman (Shtyka et al. 2017) can calculate pressure drop for the deposition of nanostructured particles. The expression below provides for the estimation of the diameter of the free flow of particles (Biskos et al. 2006; Madler, Lall & Friedlander 2006).
dci =deq![]() (Equation 2.21)
(Equation 2.21)
Where ????i represents the packing density of a layer based on the penetration profile of particles, as shown in equation 2.11. The assumption of the approach developed by Bourrous et al. (2016) is that the degree of clogging does not influence the penetration factor (k) and the efficiency is 100%. These assumptions apply to submicronic particles with pore diameters less than 500nm and filters with high-efficiency level.
Filter Clogging
Classical theories give an accurate or numerical solution to the filtration that occurs around clean fibrous media placed along the direction of the flow in two-dimensional orientation (Kuwabara 1959). Currently, classical filtration theories have resulted in numerous semi-empirical expressions employed in predicting pressure drop and collection efficiency of filter media (Podgorski, Balazy & Gradon 2006).
Since filters are not always clean, the deposition of particles results in the formation of complicates structures called dendrites. With time, expressions of filtration tend to become inaccurate as particles deposit on the fibers and change the streamlines of air (Payatakes & Gradon1980; Li & Marshall 2007). Therefore, the determination of pressure drop and collection efficiency is accurate at the primary phases of filtration when filters are clean.
Owing to the deposition and clogging of filters, Davies (1973) incorporated the aspect of resistance in the filtration model.
![]() (Equation 2.22)
(Equation 2.22)
Where W represents the ratio (ΔP/Q), Q is the volumetric flow rate of particles, and β is a constant. Furthermore, Davies (1973) formulated an equation that describes the penetration profile of clogged filters.

Where γ represents the dimensionless factor that applies in efficient filters.
Considerations of particle concentration (No) indicate that uniform deposition occurs at the inlet filter with particular thickness (δh), as expressed in the following equation.
dN/dt = UN0/δh(1 – Pt) (Equation 2.24)
Further, simplification and integration of equation 2.24 enhances the calculation of concentration.

Where P represents 1/t ![]() .
.
Reference List
Bergman, W, Taylor, R, Miller, H, Bierman, AH, Hebard, HD, Roza, RA & Lum BY 1978, ‘Enhanced filtration program at LLL: a progress report’, in 15th DOE Nuclear Air Cleaning Conference, California University, Livermore, CA, pp. 1-42.
Biskos, G, Paulsen, D, Russell, L, Buseck, PR & Martin, ST 2006, ‘Prompt deliquescence and efflorescence of aerosol nanoparticles’, Atmospheric Chemistry and Physics, vol. 6, no. 12, pp. 4633-4642.
Bourrous, S, Bouilloux, L, Ouf, F, Appert-Collin, JC, Tampere, L & Morele, Y 2014, ‘Measurement of the nanoparticles distribution in flat and pleated filters during clogging’, Aerosol Science and Technology, vol. 48, no. 4, pp. 392-400.
Bourrous, S, Bouilloux, L, Ouf, FX, Lemaitre, P, Nerisson, P, Thomas, D, Appert-Collin, JC 2016, ‘Measurement and modeling of pressure drop of filters clogged with ultrafine particles’, Powder Technology, vol. 289, pp. 109-117.
Davies, CN 1973, Air filtration, Academic Press, New York, NY.
Elmoe, T, Tricoli, A, Grunwaldt, JD & Pratsinis, SE 2009, ‘Filtration of nanoparticles: evolution of cake structure and pressure-drop’, Journal of Aerosol Science, vol. 40, no. 11, pp. 965-981.
Elmoe, TD, Tricoli, A & Grunwaldt, JD 2011, ‘Characterization of highly porous nanoparticle deposits by permeance measurements’, Powder Technology, vol. 207, no. 1-3, pp. 279-289.
Endo, Y, Chen, DR & Pui, DY 2002, ‘Theoretical consideration of permeation resistance of fluid through a particle packed layer’, Powder Technology, vol. 124, no. 1, pp. 119-126.
Fowler, Z & Hertel, K 1940, ‘Flow of a gas through porous media’, Journal of Applied Physics, vol. 11, no. 7, pp. 496-502.
Fuchs, N & Stechkina, I 1963, ‘A note on the theory of fibrous aerosol filters’, Annals of Occupational Hygiene, vol. 6, no. 1, pp. 27-30.
Greenspan, L 1977, ‘Humidity fixed points of binary saturated aqueous solutions’, Journal of Research of the National Bureau of Standards Section A: Physics and Chemistry, vol. 81 A, no. 1, pp. 89-96.
Jaganathan, S, Tafreshi, HV & Pourdeyhimi, B, 2008, ‘A realistic approach for modeling permeability of fibrous media: 3-D imaging coupled with CFD simulation’, Chemical Engineering Science, vol. 63, no. 1. p. 244.
Juda, J & Chrosciel, S 1970, ‘Ein theoretisches modell der druckverlusterhöhnung beim filtrationsvorgang’, Staub Reinhaltung der Luft, vol. 30, no. 5, pp. 196-198.
Kanaoka, C & Hiragi, S 1990, ‘Pressure drop of air filter with dust load’, Journal of Aerosol Science, vol. 21, no. 1, pp. 127-137.
Kasper, G, Schollmeier, S & Meyer, J 2010, ‘Structure and density of deposits formed on filter fibers by inertial particle deposition and bounce’, Journal of Aerosol Science, vol. 41, no. 12, pp. 1167-1182.
Kirsch, V 1998, ‘Method for the calculation of an increase in the pressure drop in an aerosol filter on clogging with solid particles’, Colloid Journal of the Russian Academy of Sciences: Kolloidnyi Zhurnal, vol. 60, no. 4, pp. 439-443.
Kuwabara, S 1959, ‘The forces experienced by randomly distributed parallel circular cylinders of spheres in a viscous flow at small Reynolds number’, Journal of the Physical Society of Japan, vol. 14, no. 4, pp. 527-532.
Letourneau, P & Mulcey, PJV, 1990, ‘Aerosol penetration inside HEPA filtration Media’, in 21st DOE Nuclear Air Cleaning Conference, San Diego, California, CA, pp. 128-143.
Letourneau, P, Renaudin , V & Vendel, J 1992, ‘Effects of the particle penetration inside the filter medium on the HEPA filter pressure drop’, in 22th DOE Nuclear Air Cleaning Conference, Denver, Colorado, CO, pp. 128–143.
Li, SQ & Marshall, JS 2007, ‘Discrete element simulation of micro-particle deposition on a cylindrical fiber in an array’, Journal of Aerosol Science vol. 38, no. 10, pp. 1031-1046.
Liu, R, Jiang, Y, Li, B & Yu, L 2016, ‘Estimating permeability of porous media based modified Hagen-Poiseuille flow in torturous capillaries with variable lengths’, Microfluid Nanofluid, vol. 20, no; 120, pp. 1-13.
Madler, L, Lall, AA & Friedlander, SK 2006, ‘One-step aerosol synthesis of nanoparticle agglomerate films: simulation of film porosity and thickness’, Nanotechnology, vol. 17, no. 19, p. 4783.
Payatakes, AC & Gradon, L 1980, ‘Dendritic deposition of aerosols by convective Brownian diffusion for small, intermediate and high particle Knudsen numbers’, AICHE Journal vol. 26, no. 3, pp. 443-454.
Payet, SB, Boulaud, D, Madelaine, G & Renoux, A 1992, ‘Penetration and pressure drop of a HEPA filter during loading with submicron liquid particles’, Journal of Aerosol Science, vol. 23, no. 7, pp. 723-735.
Podgorski, A, Balazy, A & Gradon, L 2006, ‘Application of nanofibers to improve the filtration efficiency of the most penetrating aerosol particles in fibrous filters’, Chemical Engineering Science, vol. 61, no. 20, pp. 6804-6815.
Sakano, T, Otani, Y, Namiki, N & Emi, H 2000, ‘Particle collection of medium performance air filters consisting of binary fibers under dust loaded conditions’, Separation and Purification Technology, vol. 19, no. 1, pp. 145-152.
Saleh, A, Fotovati, S, Tafreshi, HV & Pourdeyhimi, B 2014, ‘Modeling service life of pleated filters exposed to poly-dispersed aerosols’, Powder Technology, vol. 266, pp. 79-89.
Schmidt, E & Loeffler, F 1991, ‘Analysis of dust cake structures’, Particle & Particle Systems Characterization, vol. 8, no. 2, pp. 105-109.
Shtyka, O, Przybysz, L, Blaszczyk, M & Sek, J 2017, ‘Konzeny-Carman theory for modeling of porous granular structures saturation with emulsion during imbibition process’, PLoS One, vol. 12, no. 12, pp. 1-11.
Thomas, D, Ouf, F, Gensdarmes, F, Bourrous, S & Bouilloux, L 2014, ‘Pressure drop model for nanostructured deposits’, Separation and Purification Technology, vol. 138, pp. 144-152.
Thomas, D, Penicot, P, Contal, P, Leclerc, D & Vendel, J 2001, ‘Clogging of fibrous filters by solid aerosol particles experimental and modeling study’, Chemical Engineering Science, vol. 56, no. 11, pp. 3549-3561.
Walsh, D 1996, ‘Recent advances in the understanding of fibrous filter behavior under solid particle load’, Filtration and Separation, vol. 33, no. 6, pp. 501-506.
Wise, ME, Martin, ST, Russell, LM & Buseck, PR 2008, ‘Water uptake by NaCl particles prior to deliquescence and the phase rule’, Aerosol Science and Technology, vol. 42, no. 4, pp. 281-294, 2008.
Yu, A, Bridgwater, J & Burbidge, A 1997, ‘On the modeling of the packing of fine particles’, Powder Technology, vol. 92, no. 3, pp. 185-194.
Yu, AB, Feng, CL, Zou, R & Yang, RY 2003, ‘On the relationship between porosity and interparticle forces’, Powder Technology, vol. 130, no. 1-3, pp. 70-76.