Introduction
Production management is one of the core company functions that primarily deal with planning, forecasting and marketing of a commodity during the course of its development (Hill and Jones 2007).
Production management primarily comprises of product development and product marketing, with a primary objective of maximizing revenue from sales, increasing the market share and increasing the profit margins.
In most cases, production management can be integrated with supply chain operations of a business enterprise, in order to facilitate the movement of commodities produced by the business enterprise. This paper analyses two case studies with respect to their aspect of production management.
Case 1: The Fred and Barney Cookie Company
X-bar and Range charts serve as control charts that have processes containing one or more sub group sizes. The x-bar and the range charts are deployed after gathering measurements in sub groups classified between 2 to10 observations, whereby each subgroup is a representation of the production processes at that particular time.
They are primarily used for assessing the stability and predictability of given process during production. The x-bar chart normally reveals the rate of mean changes during a time period, while the Range chart is used to indicate how the ranges of the subgroups varies with respect to time.
The Range Chart can also be used in monitoring the various theories that are related to process improvement. Both the x-bar and Range charts are compared with the control limits in order to ascertain the predictability and the stability of the process (Hill and Jones 2007).
The control limits are normally determined from the stratified samples by use of a scale factor used in the estimation of the sigma, sometimes called the standard deviation. Basing on the estimate, one can either add or subtract thrice the value of the standard deviation in order to determine the upper and lower control limits in their respective zones.
The control limits for x-bar chart are determined by the mean range, implying that if the range is not within the control zone, then there is no need to analyze the control limits on the x-bar chart.
After an analysis of the range chart, it is important to evaluate the control points that are found on the x-bar chart and carry out run tests on the production data. Cases of special consideration have to be eliminated prior to the interpretation of range chart.
After analysis of the range chart, the control points on the x-bar chart have to be analyzed for control points. Similarly, cases of special consideration have to be eliminated.
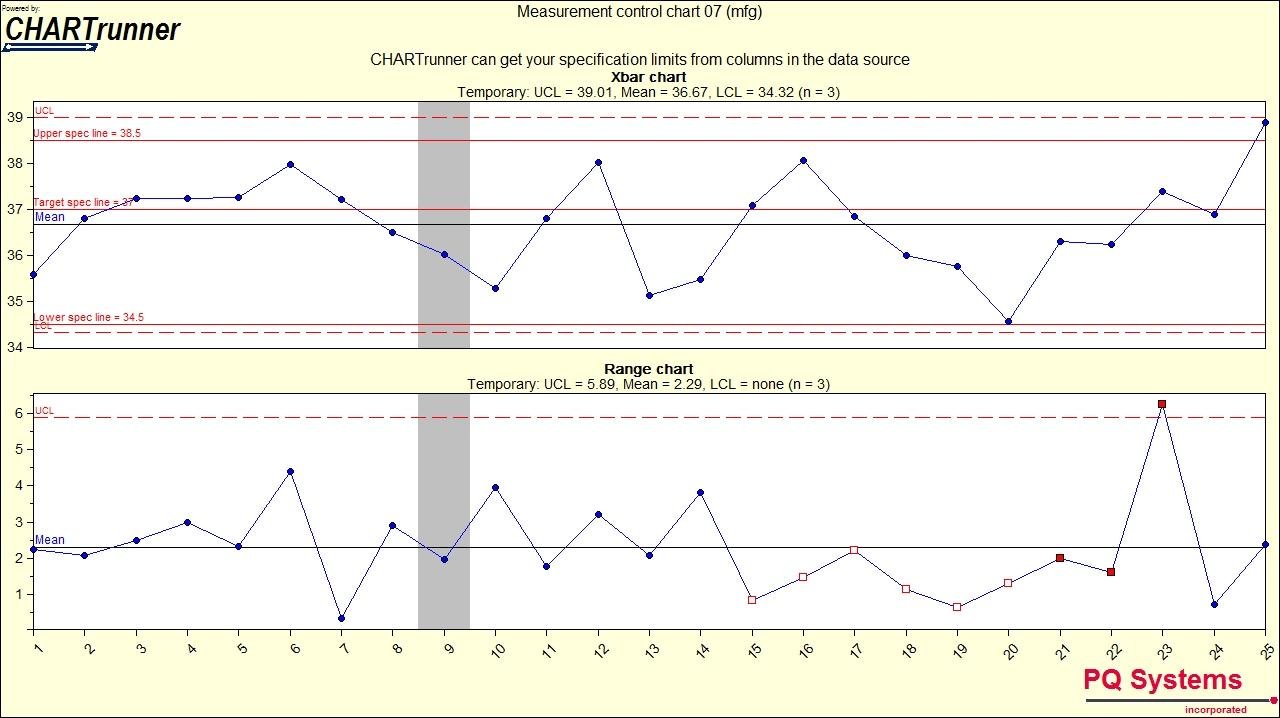
The following is a representation of the X-bar and Range chart of the data provided relating to The Fred and Barney Cookie Company as simulated under Chart Runner. The Upper and lower control limits for the X bar charts are 11.6 and 10.8 respectively, while the upper and lower control limits for the range charts according to the provided data are 0.4 and 1.7 respectively.

From the x-bar and the R-charts, it is evident that the process is under control. This is because the upper and the lower control limits are equally distributed above the average value of the sample. This implies that is the process is effectively controlled about the mean.
Process control is an important aspect of aspect supply chain management due to the fact that it entails both product development and product marketing. The above concept can be best explained by use of process integration with supply chain management.
Conventionally, an efficient supply chain management should incorporate the core business functions into the operations of supply chain management.
Case 2: Finger Spring
House of quality is a diagrammatic representation that defines the relationship that exists between the desires of the customers and capabilities of the firm or product.
The House of Quality is an integral element of the Quality Function Deployment and makes use of the planning matrix in order to ascertain the relationship between the wants of customers and how the company is strategizing to meet the wants of their customers.
The basic outlook of the House of Quality has a correlation matrix at the roof; the needs of the customers are matched against the features of the product at the main part, and then an evaluation of the competitors at the porch (Hauser 1990).
The designing of the House of Quality bases on the perception that the design of products should be such that it depicts the wants of the customers and their respective preferences.
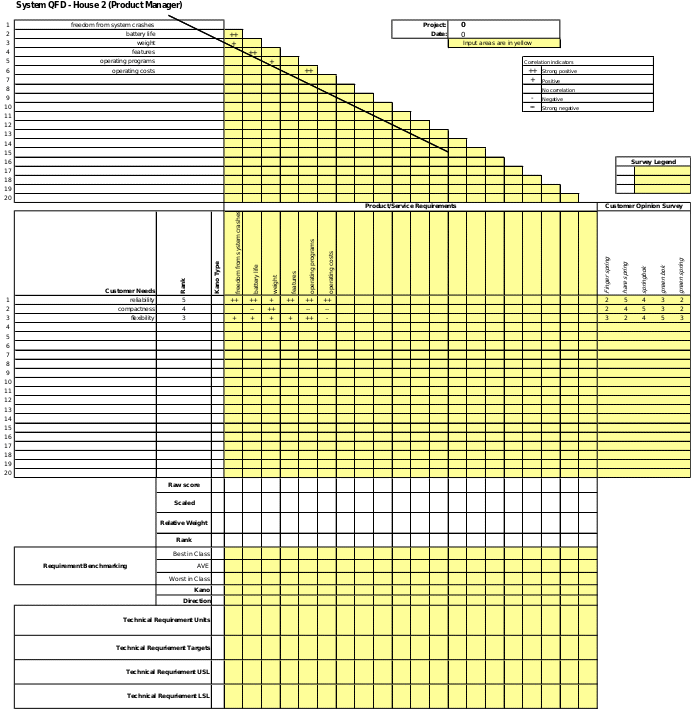
In addition, the House of quality plays an integral role in escalating the cross functional integration in business enterprises that utilize it, with a specific consideration to the marketing, manufacturing and engineering functions (Hill and Jones 2007). The following is the House of Quality Diagram for Finger Spring.
The customer requirements section is an important part of the House of Quality matrix that has to be completed; it is normally a list of the customer requirements in accordance with product development (Hill and Jones 2007). This is what is referred to as the Voice of the Customer.
This data is collected by conducting information surveys with the customers and they are prompted to outline what they need and the problems associated with the product. The Voice of customer for the case of the Finger Spring significantly depends on product reliability, compactness and flexibility; with reliability being given a higher consideration, followed by compactness and then flexibility.
The planning matrix is placed on the right hand portion of the House of Quality Diagram matrix. It is principally used in the quantification of the customer requirements and their opinions of other existing products.
In addition, the planning matrix provides a framework through which the design team can adjust their priorities in accordance with the Voice of Customer. The quantified values in the planning matrix are derived from the potential customers by use of a questionnaire.
Importance weighting is used in denoting the relative importance of every design requirement of the potential customers in accordance to their own opinions. In this case, reliability is given a rank of 5; compactness has been given a rank of 4, while flexibility has been given a rank of 3. In addition, the planning matrix evaluates the level of customer satisfaction with other similar products available in the market.
This is usually done by taking into consideration the performance of other products in meeting their requirements. In the case of Finger Spring, reliability, compactness and flexibility has different values for the various competing products, and has already been quantified in Table 2 of the assignment.
The technical requirements section represents the voice of the company and offers a description of the product in accordance with the company perception.
The data in this section is used in the representation of the measurable characteristics associated with the product, which the Finger Spring perceives as meeting the customer needs. The technical requirements include the size, price, weight, features, battery life and the operating cost of the product, which are matched against the competitors’ products in the market.
The interrelationships section is the key component of the House of Quality diagram. Its principal objective is to convert the requirements as presented by the potential customer to the technical features of the developed product.
The Roof of the House of Quality plays an inetgral role in the identification of technical requirements used in the characterization of the product. Basically, the question of concern is whether an improvement in the technical design requirement will translate into an enhancement or a deteroriation in another design requirememnts.
In case of deteroriation, trade offs have to be adopted, while in cases of enhancements, it is indicated by alternative symbol. The representation of the roof helps the technical design team to focus on the core design areas that aim at improving customer experience.
The targets section represents the conclusions of the House of Quality Diagram, and comprises of the technical considerations, competitive benchmarks for the product and the targets. The technical priotities represents the significance of each design requirement in attaining customer satisfaction.
Competitive benchmarks are an evaluation of the company’s existing products and other competing products in the market and helps in the identification of the taget levels during product development.

Reference List
Hauser, John. 1990. How Puritan-Bennet used the house of quality. Sloan Management Review 90, no. 1 (March): 65-67.
Hill, Charles, and Gareth Jones. 2007. Strategic Management: An Integrative Approach. Boston: Houghton Mifflin Co.