Introduction
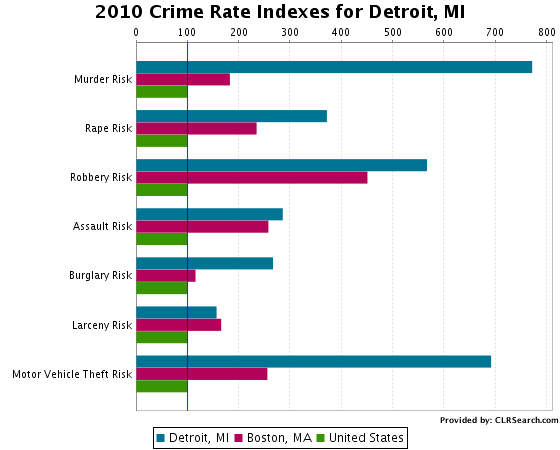
Crime in the United States has declined gradually since the early 1990s. Statistics indicate that property crimes have decreased in the whole country within the same period (Baltic 9). When I was selecting the appropriate crime data for this research, my initial expression was that property crime has not reduced at the same rate as other types of crime. The reason is that different types of crimes have varied causative factors. This implies that some neighborhoods are more vulnerable to some specific crimes than other areas. This research paper compares property crime rates between Detroit, Michigan, and Boston, Massachusetts. In both neighborhoods, we expect different trends and statistics relating to property crimes. This is in lieu of the fact that Detroit ranks higher than Boston in terms of the crime rate index (Bruce and Zimmerman 39). Apparently, it is safer to live in Boston than in Detroit according to crime statistics released by the police department (Baltic 12). In addition, the paper hypothesizes that the rates of property crimes in both cities have reduced significantly to correspond with the national average. It is important to mention that various demographic, social, and economic factors predispose people to property crime. As such, the paper will explain the variations that exist in causative factors of property crime in both neighborhoods. They include demographic characteristics such as gender, race, and age among many others. Moreover, quantitative data of property crime in both neighborhoods will be instrumental in making comparisons. Essentially, the main objectives of this research paper are to select information, make comparisons and draw inferences about property crime in both cities.
Body Paragraph 1: Boston – Massachusetts
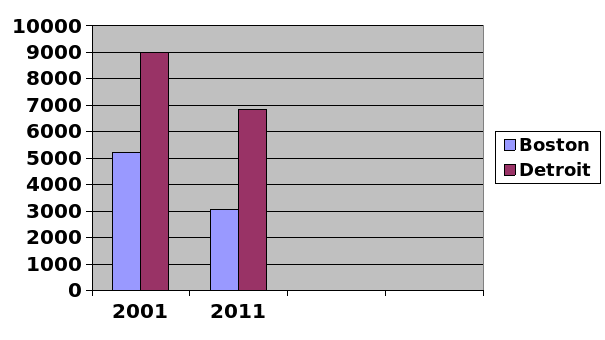
Boston is the biggest city in Massachusetts. The city has seen a reduction in property crime over the last decade. Robberies, burglaries, theft, and auto thefts are the major types of property crime that are apparent in Boston (Bruce and Zimmerman 39). In 2001, FBI records indicate that the city experienced about 420 crimes per one hundred thousand people (Bruce and Zimmerman 39). This number has dropped sharply over the last decade. In 2011, there were 303 robberies per one hundred thousand people. In other words, robberies have declined by approximately 27.8% between 2001 and 2011. In addition, burglaries have reduced modestly over the same period. Statistics indicate that burglaries have declined by a mere 4% between 2001 and 2011 (Baltic 15). While it is apparent that the burglaries have not reduced as much as robberies, it is imperative to mention that Boston has among the lowest rates of burglaries reported in the United States (Greenberg 23). Indeed, it has a rate that is well below the national average. Like in many neighborhoods, incidences of theft are many in comparison to other types of property crimes (Bruce and Zimmerman 39). In 2001, incidences of theft in the city surpassed 3,000 per one hundred thousand people. This has dropped significantly by approximately 30% over the last decade. In fact, statistics indicate that only 2,013 incidences per one hundred thousand people occurred in 2011. Finally, auto theft is a type of property crime that has flourished in Boston (Baltic 11). In 2001, the rate of auto theft in the city was its highest. Police Department indicates that over 1,300 auto theft cases were reported in 2001(Baltic 17). This number decreased drastically by 77.9% in 2011. Boston had a population of 617,594 people in 2011. The per capita income was $31,856 in the same period. The total number of crimes in 2011 was about 3063 per one hundred thousand people (Greenberg 17). It is important to divide the number of total property crimes by the population in order to find the mean. On average, the property crime rate was about 2.9% in the city. In 2001, the total number of property crimes within the city was about 5,200 per one hundred thousand people. On average, the property crime rate was about 5.1% in the city within the same period (Baltic 12). The median of property crime in Boston is four while the range is 2.2. Various social-economic factors have created a thriving ground for the incidences of crime within the neighborhood. Ranging from the high cost of living (measured using consumer price index) to high unemployment rates within the country, many factors have enhanced crime within the city (Greenberg 23).
Body Paragraph 2: Detroit – Michigan
Detroit ranks second in terms of the crime rate index (CRI). In other words, the city is safer than only 2% of neighborhoods in the United States. Although the rate of general crime in the neighborhood has reduced over the last decade, it remains high in comparison to the national average. In 2011, the city recorded about 696 incidences of robbery per one hundred thousand people (Dunn 56). This shows a significant reduction of 24% in the occurrences of robbery within the city since 2001 (Booza 239). Another property crime that is overwhelming within the city is burglary. In 2011, Detroit had 2,243 incidences of burglary per one hundred thousand people. This reflected a decline in a burglary. In fact, incidences of burglary dropped by 18.1% from 2,967 cases that were reported in 2001. Theft remains high within the neighborhood. In 2011, police statistics indicate that the city reported approximately 2,308 incidences of theft per one hundred thousand people (Booza 243). This implies that incidences of theft had decreased significantly over the last decade. In 2001, the city had 4,502 cases of theft per one hundred thousand people. Auto theft has remained relatively high within the neighborhood although there are indications that the rates are declining gradually. The rate of auto theft stood at about 1,594 per one hundred thousand people in 2011 (Booza 248). This reflects a marginal decline in the number of auto theft since 2001. In fact, statistics show that there was a 3% decrease in auto theft in the neighborhood between 2001 and 2011. By 2011, Detroit had a population of approximately 706,585 people according to US Census Bureau (Baltic 10). The per capita income was $29,856 in the same period (Dunn 83). The total number of property crimes in 2011 was approximately 6841 per one hundred thousand people. It is imperative to divide the number of total property crimes by the population in order to find the mean. On average, the property crime rate was about 6.8% in the city (Dunn 65). In 2001, the total number of property crimes within the city was about 9001 per one hundred thousand people (Booza 242). On average, the property crime rate was about 8.9% in the city within the same period. The median of property crime in Detroit is 7.8 while the range is 2.1. Many demographic characteristics of the residents have enabled crime to thrive within the neighborhood (Bruce and Zimmerman 39). In particular, Detroit has a high number of black residents than any other city in Michigan (Booza 246). Considering that the black population has been overrepresented in criminal statistics, it is, therefore, logical to infer that race has a strong correlation with the crime rate in Detroit. Besides, high rates of unemployment in the country may have led to significantly high levels of crime within the area. The rationale is that income per capita of the city is relatively low when compared to the national average (Booza 248).
Body Paragraph 3: Media Sources with Current Events
Recent events have inspired the need to compare different crime rates within the two neighborhoods. In an article relayed on Huffington Post, the rates of crime in Detroit have spurred over 40% of the dwellers to plan to vacate from the city within the next few years (Lambertz 2). Property crimes in the area do not only elicit such a move by its residents but also contribute to the ever-rising insecurity within the region. Lambertz says that the city tops the list of the most dangerous neighborhoods within the area (1). On the other hand, Boston has remained relatively safe when compared to many neighborhoods in the country. According to New York Times, there has been a notable shift in property crime across the US (Savage 1). Savage says that crime rates in Boston have remained relatively low implying that many citizens living in crime-prone areas are seeking to migrate to Boston (1). The rationale is that the city has recorded lower property crime rates than the entire nation. While it is true that Boston is relatively safer than other cities, Boston Bombings led to a decreased desire to live in the city (Savage 1). Nonetheless, the crime rates in Detroit have been a major cause of concern for many residents.


Conclusion
In essence, statistics of property crime in Detroit and Boston illustrate a sharp contrast. While both neighborhoods have seen a rapid reduction in property over the last decade, crime remains relatively high in Detroit. In fact, property crime rates in Detroit have remained above the national average. Consequently, it is important to mention that statistics released by FBI indicate that Detroit is one of the most dangerous cities in US (Dunn 34). Causative factors of crime vary greatly between the two cities. This is in terms of demographic, socio-economic and cultural factors that are present or absent in the two cities. To that end, it is logical to infer that Boston is a safer city than Detroit.
Works Cited
Baltic, Sarah. Crime in the United States 2011, Boston, MA: Sage Publishers, 2011. Print.
Booza, Jason. “Reality v. Perceptions: An Updated Analysis of Crime and Safety in Downtown Detroit.” Michigan Metropolitan Information Center, 24.4 (2009): 238-250. Print.
Bruce, Benson and Zimmerman, Paul. Handbook on the Economics of Crime, New York: McGraw Hill Publishers, 2010. Print.
Dunn, Gwenavere. Crime in the United States 2012, New Jersey: Prentice Hall, 2012. Print.
Greenberg, Michael. Restoring America’s Neighborhoods: How local people make a difference, New York: Rutgers University Press, 2009. Print.
Lambertz, Kate. “Detroit Crime Rates Makes over 50 Percent of Residents Want to Leave.” Huffington Post. 2012: 3. Print.
Savage, Charlie. “Two Powerful Signals of Major Shift on Crime.” New York Times. 2013: 2. Print.