- Case Background
- Data Collection
- Definition of Optimization and Comparison of Operational Efficiency
- Patient Satisfaction and Provider Efficiency Analysis
- Addressing Efficacy and Quality in Primary Care Based on Patient Feedback
- Setting Productivity and Patient Satisfaction Benchmarks for Providers
- Balancing Performance Benchmarks with Quality Patient Care
- Reference
Case Background
In this paper, key terms such as effectiveness, efficiency, benchmarking, optimization, performance, efficacy, and quality will be examined within the context of a hypothetical case study, where a new administrative resident at a family practice clinic received data on daily patient encounters and quarterly satisfaction scores to analyze clinic performance.
The analysis begins with the collection of data on individual providers, specifically their average number of patient visits per hour. Additionally, the mean patient satisfaction scores for each provider will be listed to assess overall care quality. To evaluate productivity efficiency, each provider’s total number of patient visits per hour will be compared against the expected benchmark of four patients per hour. Furthermore, the practice’s operational efficiency will be calculated by comparing the total number of patients seen per day (actual output) with the expected operational capacity (input).
Data Collection


Table 1 – Qualitative Feedback of Patients Regarding Their Providers.
Table 2 – Provider Data and Efficiency Calculations.
Operational Efficiency = Total number of practice patients actually seen per day output/ Expected operational capacity
= (5+6+3+4.5+4+2.5+4+5.5) / (4*8)
= 35 / 32
= 109.375%
Definition of Optimization and Comparison of Operational Efficiency
Optimization is the process of maximizing the effectiveness and potential of available resources to achieve the desired outcome with enhanced efficiency. In a medical setting, this means ensuring each resource, from time to equipment, is used to the fullest possible extent to ensure optimum care (Ahsan et al., 2019). From the data provided in the table, it can be ascertained that the operational efficiency of the current practice amounts to 109.375% (Table 1). Therefore, this percentage witnesses that the clinic does not only meet but even surpasses the expectations of the system. It doesn’t come to be a random outcome as it is instead a reflection of a well-organized and efficient optimized workflow the clinic succeeded in creating.
Patient Satisfaction and Provider Efficiency Analysis
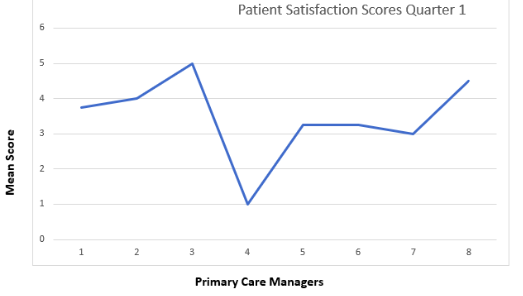
A tangible relationship exists between patient satisfaction and the efficiency of a provider. From an examination of the data, it is discernable that Providers 2 and 8 scored high in efficiency at over 100%, as well as relatively high scores in patient satisfaction (Table 1). It means that their ability to manage these activities effectively had a positive impact on patient experience.
On the other hand, we note Provider 4, who attended to more patients and recorded the lowest patient satisfaction scores. It highlights an important principle, though: that pure efficiency and high patient turnover do not amount to quality patient care. The most basic ones, like the quality of interaction, listening to their concerns, and giving comprehensive care, are equally important.
Addressing Efficacy and Quality in Primary Care Based on Patient Feedback
Qualitative feedback is invaluable as it provides in-depth insights into patients’ perceptions of care. In assessing Provider 4, a common observation – notwithstanding attending to many patients, the satisfaction scores are considerably low. Rushed appointments, meaning inadequate time for consultations or hastily conducted examinations, were the general gist of the feedback (Table 1). This feedback result sets up a picture whereby high effectiveness in numbers does not necessarily mean efficacy in the quality and depth of care imparted to the patients. It then becomes a tangible reminder that healthcare is not about numbers but rather the overall experience of patients.
Setting Productivity and Patient Satisfaction Benchmarks for Providers
As a clinic manager, benchmark-setting needs to be a holistic process. It is less about reaching the numbers and more about achieving them without minimizing the quality of care. An approach has to do both the ways – one, that at least four patient visits are seen each hour and, simultaneously, the average patient satisfaction score is maintained above 3 (Table 1). It drives from an efficiency point of view without compromising on desired patient satisfaction. It’s a delicate balance but pivotal for the clinic’s reputation and success.
Balancing Performance Benchmarks with Quality Patient Care
Quality care with all performance benchmarks intact is an art. It is called fine-tuning operational guidelines so that productivity targets are met and, at the same time, not losing out on the essence of healthcare – patient well-being. One of the best ways to strike such a balance is through cultivating a culture of periodic feedback. Both staff and patient should never shy from expressing their experiences and concerns. Through such feedback, an organization will get the needed information on areas to improve its level of performance. Further periodic training sessions for the staff would reiterate this balance of 100% numbers achieved along with the core tenet of providing excellent patient care.
Reference
Ahsan, K. B., Alam, M. R., Morel, D. G., & Karim, M. A. (2019). Emergency department resource optimisation for improved performance: A review. Journal of Industrial Engineering International, 15(S1), 253–266. Web.